

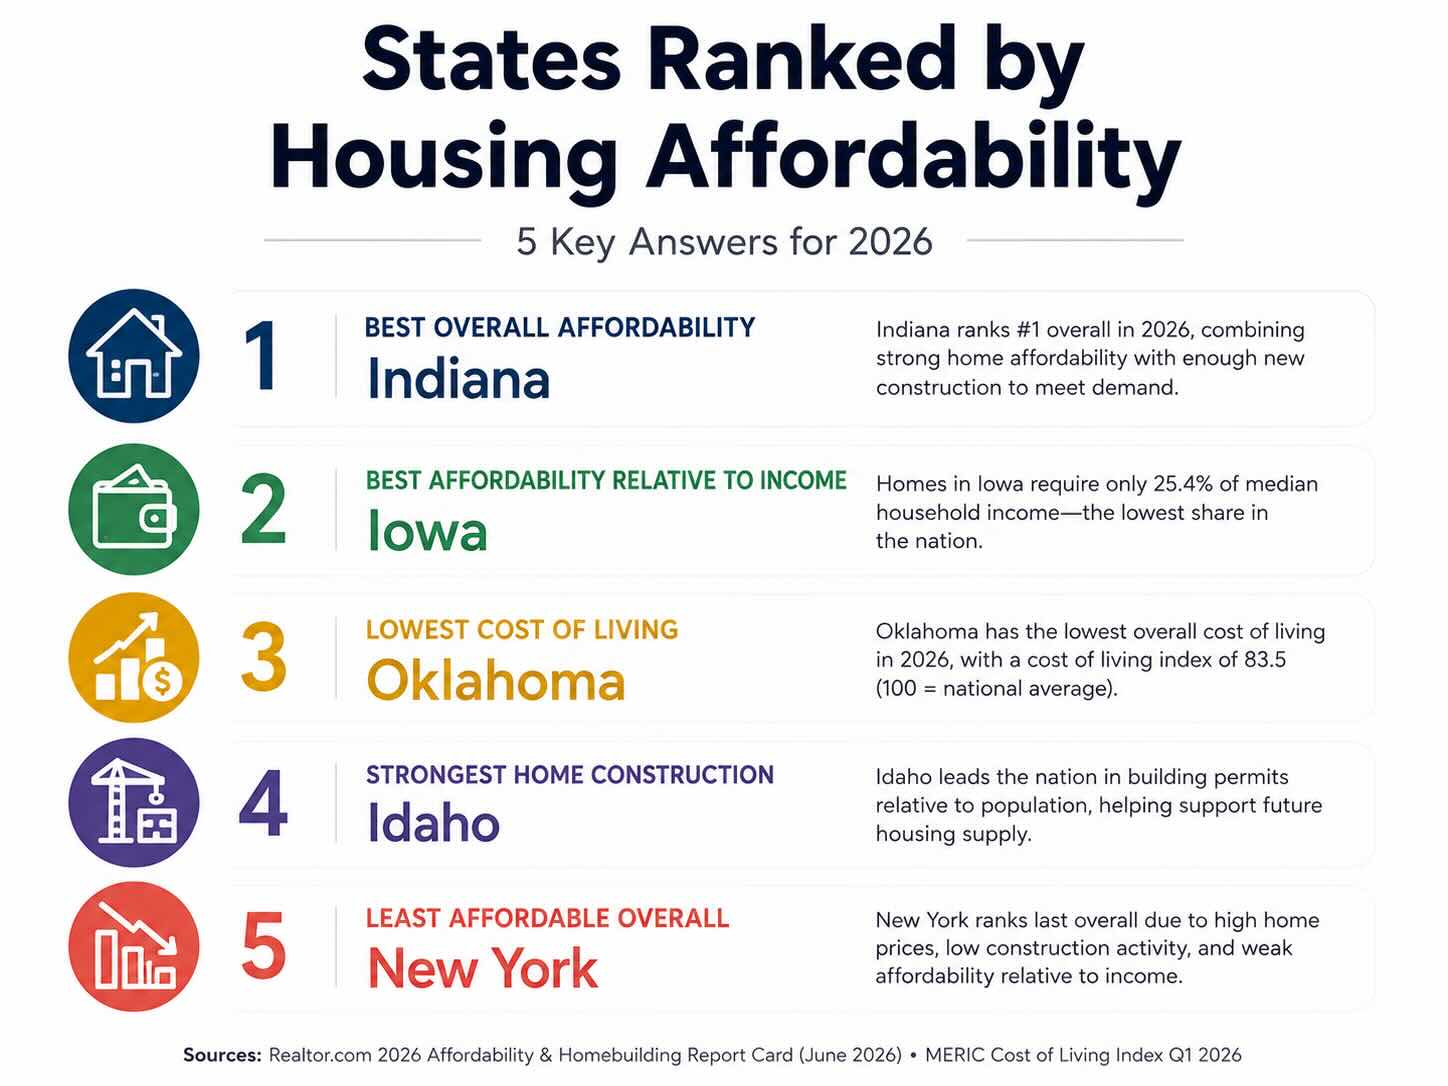
Indiana ranks #1 for housing affordability and homebuilding in 2026, followed by Iowa, South Carolina, Texas, and North Carolina. But there is an important distinction: Iowa is the most affordable state for buying a home relative to local income, while Oklahoma has the lowest overall cost of living in the latest 2026 data.
Those results are not contradictory. Housing affordability can measure several different things. A state can have inexpensive homes but weak local incomes, affordable homes today but too little new construction, or a low overall cost of living while homeownership remains difficult in its largest cities. For someone considering long-distance moving, separating those measures gives a much better picture of what housing will actually cost after the move.
Housing Affordability in 2026: Key Points
- #1 overall: Indiana. Indiana leads Realtor.com’s 2026 Affordability & Homebuilding Report Card with a score of 76.3 out of 100 and an A grade.
- Best pure affordability: Iowa. A median-priced Iowa home requires about 25.4% of median household income, the lowest share in the country.
- Lowest overall cost of living: Oklahoma. MERIC’s Q1 2026 Cost of Living Index places Oklahoma first at 83.5.
- Only 11 states pass the median-buyer affordability test. In just 11 states, the median-priced home is affordable to the median earner under the 30% housing-cost measure used in the 2026 report.
- The Midwest and South dominate. Every state receiving an A or B in the 2026 affordability and homebuilding report is in one of those two regions.
- New York ranks last overall. High prices, low building activity relative to population, and expensive new construction push New York to #51 when Washington, D.C. is included.
States Ranked by Housing Affordability in 2026
The most useful overall ranking for 2026 comes from Realtor.com’s Affordability & Homebuilding Report Card. Rather than ranking states only by home price, the study gives equal weight to current affordability and homebuilding.
That distinction matters. A state with affordable homes today may become much less affordable if population growth consistently outpaces housing construction. A state with higher prices can have a stronger long-term outlook if builders are adding enough competitively priced homes to meet demand.
| Rank | State | 2026 Score | Grade | Median Listing Price | Affordability Score |
|---|---|---|---|---|---|
| 1 | Indiana | 76.3 | A | $295,810 | 0.89 |
| 2 | Iowa | 75.8 | A | $282,886 | 0.96 |
| 3 | South Carolina | 75.2 | A | $363,896 | 0.68 |
| 4 | Texas | 71.0 | A- | $364,749 | 0.66 |
| 5 | North Carolina | 68.6 | B+ | $413,044 | 0.62 |
| 6 | Nebraska | 68.6 | B+ | $346,210 | 0.75 |
| 7 | Delaware | 66.1 | B | $486,044 | 0.70 |
| 8 | South Dakota | 65.8 | B | $379,491 | 0.61 |
| 9 | Arkansas | 65.2 | B | $299,817 | 0.74 |
| 10 | Oklahoma | 64.5 | B | $299,410 | 0.79 |
Source: Realtor.com Economic Research, 2026 Affordability & Homebuilding Report Card. The 2026 report primarily uses housing, income, population, and permit data with a 2025 reference period.
What Does “Housing Affordability” Actually Mean?
Calling a state affordable because its houses are cheap can be misleading. A $280,000 home in an area where households earn $80,000 is a very different proposition from a $280,000 home where households earn $55,000. Mortgage rates, property taxes, homeowners insurance, utilities, and the amount of new housing being built can further change the picture.
For that reason, this ranking uses several measures rather than treating “cheapest” and “most affordable” as synonyms.
| Measure | What It Answers | 2026 Leader |
|---|---|---|
| Overall affordability + homebuilding | Which state combines current affordability with enough new construction? | Indiana |
| Affordability relative to income | Where can local households most easily afford local homes? | Iowa |
| Cost of living | Where are housing and everyday expenses lowest overall? | Oklahoma |
| Housing construction intensity | Which state is building the most housing relative to population? | Idaho |
For a household deciding where to move, the second measure can be more useful than home price alone. For understanding which states may be positioned to preserve or improve affordability over time, housing construction becomes much more important.
Why Indiana Ranks #1 for Housing Affordability in 2026
Indiana takes first place because it performs well across both sides of the affordability equation rather than dominating one individual statistic.
The state’s median listing price in the Realtor.com dataset is $295,810, compared with median household income of $71,469. The estimated cost of purchasing the median-priced home consumes about 28.3% of median household income, putting Indiana below the commonly used 30% affordability threshold.
Indiana also records a REALTORS® Affordability Score of 0.89, one of the strongest results nationally.
What separates Indiana from states that simply have inexpensive homes is construction. Its share of national building permits is approximately equal to its share of the country’s population, producing a permit-to-population ratio of 1.02. In other words, housing construction is broadly keeping pace with Indiana’s population size.
That balance moved Indiana from fourth place in the previous report to first in 2026.
Iowa Is the Most Affordable State for Buying a Home Relative to Income
If the question is narrowed from “best overall housing market” to “where are homes most affordable for the people who actually live there?”, Iowa takes first place.
Iowa’s median listing price is $282,886, while median household income is $75,991. Realtor.com’s analysis calculates that a median-priced home requires about 25.4% of median household income, the lowest share in the country. Iowa also has the highest REALTORS® Affordability Score at 0.96.
The reason Iowa ranks second rather than first overall is new construction. Its permit activity is approximately proportional to its population, but newly constructed homes carry a substantial premium over existing homes. The report calculates that premium at 56%, suggesting that much of Iowa’s new inventory is being built above the entry-level portion of the market.
That distinction makes Iowa particularly important for buyers. Existing housing is exceptionally affordable relative to local earnings, even though new construction is not necessarily aimed at the same price-conscious buyer.
Which States Can a Median-Income Household Still Afford in 2026?
The national affordability picture becomes much clearer when the same standard is applied across the country. Using the 30% housing-cost threshold, a median-income household can afford the median-priced home in only 11 states.
The concentration is striking. Ten of the 11 states are in the Midwest or adjacent parts of the eastern United States. The list also demonstrates why the overall ranking and pure affordability ranking differ. Illinois, for example, has strong current affordability but ranks only 30th overall because its building-permit activity is exceptionally low relative to its population.
Cheapest States to Live in 2026
Housing affordability should also be separated from the broader question, “What is the cheapest state to live in?” In the first quarter of 2026, Oklahoma had the lowest cost of living index at 83.5.
The Missouri Economic Research and Information Center’s Cost of Living Data Series uses information from participating cities and metropolitan areas in the Council for Community and Economic Research survey.
| Rank | State | Cost of Living Index | Housing Index |
|---|---|---|---|
| 1 | Oklahoma | 83.5 | 66.9 |
| 2 | Alabama | 85.0 | 67.7 |
| 3 | Mississippi | 86.2 | 71.0 |
| 4 | Kansas | 87.6 | 77.5 |
| 5 | West Virginia | 87.9 | 71.3 |
| 6 | Indiana | 88.3 | 73.0 |
| 7 | Missouri | 88.6 | — |
Source: Missouri Economic Research and Information Center, Cost of Living Data Series, Q1 2026. MERIC calculates state indices by averaging participating cities and metropolitan areas, so the figures should not be interpreted as a survey of every community within each state.
A score of 100 represents the benchmark used by the index. Oklahoma’s 83.5 therefore indicates substantially lower measured living costs than the benchmark, while its housing component of 66.9 is especially inexpensive.
Oklahoma is therefore a strong answer to “cheapest state to live in 2026,” while Iowa is the better answer for home affordability relative to income and Indiana leads the broader housing affordability and construction ranking.
Which States Are Building Enough Homes to Support Future Affordability?
Home prices describe the market buyers face today. Construction helps show where that market may be heading.
Realtor.com’s permit-to-population measure compares a state’s share of all U.S. residential building permits with its share of the U.S. population. A score around 1 means construction is roughly proportional to population. A figure substantially above 1 indicates unusually strong homebuilding relative to population size.
| State | Permit-to-Population Ratio | New Construction Premium |
|---|---|---|
| Idaho | 2.10 | -4.6% |
| South Carolina | 1.96 | -5.7% |
| North Carolina | 1.84 | -1.5% |
| Utah | 1.82 | 4.7% |
| Florida | 1.79 | -3.1% |
South Carolina provides one of the clearest examples of why construction belongs in an affordability ranking. Its current home affordability is weaker than Iowa’s or Indiana’s, but the state issues nearly twice the share of building permits that its population share would predict. New construction is also priced about 5.7% below existing inventory in the dataset.
North Carolina shows a similar pattern. New homes are about 1.5% less expensive than existing listings, while building activity is far above its population share.
Texas operates at a different scale. The state accounts for 14.6% of U.S. residential building permits despite containing about 9.3% of the population. Florida accounts for another 12.3% of permits. Together with California, North Carolina, Georgia, Arizona, and South Carolina, seven states account for more than half of the country’s permitted housing units.
Building more homes does not automatically make an expensive market affordable, but supply matters. Idaho leads the construction-intensity measure and still struggles with current affordability, illustrating why both sides of the equation need to be considered.
Least Affordable States for Housing in 2026
Looking only at home prices would put Hawaii and California near the bottom. Once affordability and housing supply are considered together, however, New York ranks last overall.
| Overall Rank | State | Score | Grade | Median Listing Price |
|---|---|---|---|---|
| 46 | Connecticut | 29.0 | F | $518,892 |
| 47 | California | 21.7 | F | $742,305 |
| 48 | Hawaii | 16.6 | F | $767,360 |
| 49 | Rhode Island | 11.8 | F | $563,235 |
| 50 | Massachusetts | 11.2 | F | $763,660 |
| 51 | New York | 8.5 | F | $668,173 |
New York’s problem is the combination of price and supply. Its $668,173 median listing price requires an estimated 55.2% of median household income to afford. At the same time, its permit-to-population ratio is only 0.45, meaning the state’s share of national residential permits is less than half its share of the national population.
New construction does not currently provide much relief. Newly built homes carry an estimated 73.9% premium over existing listings in the report’s dataset.
Massachusetts faces a similar supply problem. Hawaii and California remain exceptionally expensive in absolute terms, with median listing prices of $767,360 and $742,305 respectively. Rhode Island and Connecticut complete the six states receiving F grades.
Why the Midwest and South Dominate Housing Affordability Rankings
The geographic divide in housing affordability is unusually strong. Every state receiving an A or B grade in the 2026 report is located in the Midwest or South.
Midwestern states average a score of 60.9 and an average rank of #16. Southern states average 60.4 and also rank #16 on average. Western states fall to an average score of 41.8 and average rank of #35, while the Northeast averages only 30.0 and #43.
The Midwest’s advantage is especially visible in affordability relative to local income. Iowa, Illinois, Ohio, Kansas, Indiana, Michigan, Missouri, Minnesota, and other central states combine moderate home prices with household incomes that make those prices more attainable than in many coastal markets.
The South’s advantage is more heavily connected to construction. South Carolina, North Carolina, Texas, Florida, and Georgia are adding substantial housing inventory, helping those states perform well even when their current home prices are not among the country’s lowest.
The Northeast has almost the opposite combination. High prices coexist with relatively weak residential construction in several states, leaving fewer mechanisms for new supply to ease the pressure.
Which States Improved the Most in the 2026 Housing Rankings?
The 2026 ranking is not simply a repeat of the previous year. Several states made significant moves as affordability and construction conditions changed.
| State | Previous Rank | 2026 Rank | Change |
|---|---|---|---|
| Delaware | 19 | 7 | +12 |
| Utah | 29 | 17 | +12 |
| Colorado | 27 | 18 | +9 |
| Kansas | 20 | 13 | +7 |
Delaware’s improvement combines relatively high household income with strong construction. Its permit-to-population ratio reached 1.46, meaning it is building considerably more housing than its population share alone would suggest.
Utah presents a different case. It still has a serious current affordability problem, with the median home requiring about 42.1% of median household income. However, its permit-to-population ratio of 1.82 and relatively small 4.7% new-construction premium improve its longer-term position.
Colorado follows a similar pattern. Current home costs remain high relative to income, but housing construction is healthier than in many other expensive Western markets.
Kansas moved from #20 to #13 for almost the opposite reason. Its construction numbers are less impressive, but its housing affordability is excellent: the median home requires approximately 27% of median household income.
Is Housing Affordability Getting Better in 2026?
There are signs of improvement, although the market remains far from its pre-pandemic balance.
A May 2026 joint analysis from Realtor.com and the National Association of Realtors examined how well homes listed for sale matched what households at different income levels could afford. Its national Listing-Income Alignment Score reached 74.9% in March 2026, up from 66.7% one year earlier.
That is meaningful progress, but the pre-pandemic benchmark was 84.4%. Only about 13% of metropolitan areas had reached or exceeded the study’s balanced-market threshold.
The problem is not simply that America needs more listings. The available homes also need to be priced where lower- and middle-income households can purchase them. The analysis estimated an effective shortage of approximately 311,000 listings within reach of buyers in the income ranges where supply is insufficient.
This helps explain why rising inventory does not automatically produce an affordable market. A metro can have more homes for sale while still offering relatively few choices at the prices typical local households can finance.
Housing Affordability vs. Cost of Living: What’s the Difference?
Housing affordability focuses on whether a household can reasonably pay for housing, particularly whether local incomes support local home prices. Cost of living is broader. It considers housing alongside expenses such as groceries, transportation, utilities, healthcare, and other household purchases.
That is why Oklahoma can rank first for overall cost of living while Indiana ranks first in the housing affordability and homebuilding analysis.
It is also why a low home price does not automatically make a state the best place for a particular household. Income matters. Insurance matters. Taxes matter. The type of housing available in the community where you actually plan to live matters.
State rankings are therefore most useful as a first filter. Someone considering Indiana because of its #1 ranking should still compare Indianapolis, Fort Wayne, South Bend, Evansville, and smaller communities individually. The same principle applies to Texas, Florida, North Carolina, and every other geographically large state where housing costs vary significantly between metropolitan and rural markets.
What Should You Compare Before Moving to a More Affordable State?
If lower housing costs are influencing a move, compare the price of housing with the income you realistically expect to earn after moving. A cheaper house does not necessarily improve your finances if the move also produces a substantial reduction in household income.
Homeowners should also compare property taxes and homeowners insurance at the local level rather than relying entirely on statewide averages. Insurance can materially change the cost of owning a home in areas exposed to hurricanes, flooding, wildfire, hail, or other hazards. Property taxes can vary by county and municipality, particularly where local governments rely heavily on property-tax revenue.
Families should then compare school districts, healthcare access, commute requirements, employment options, and transportation costs. These factors do not change whether a state ranks highly for housing affordability, but they can determine whether an affordable location works for a particular household.
Finally, moving expenses should be treated as a one-time transition cost rather than mixed into the long-term housing calculation. If the move crosses state lines, understanding how long-distance moving estimates, delivery windows, packing, and valuation coverage work can make it easier to budget for the transition separately from the cost of the new home.
Methodology: How We Ranked Housing Affordability
The primary 2026 ranking on this page uses Realtor.com’s 2026 Affordability & Homebuilding Report Card, published June 15, 2026. The study grades all 50 states and Washington, D.C. on a 100-point scale.
Half of the overall score measures current affordability. This incorporates the REALTORS® Affordability Score, which evaluates the share of available homes accessible to households at different income levels, and the share of median household income required to afford the median-priced home.
The other half evaluates homebuilding. The analysis compares each state’s share of national residential building permits with its share of the national population and measures the price premium or discount associated with newly constructed homes.
The 2026 report is largely based on data with a 2025 reference period. Median listing prices come from Realtor.com listings active during 2025, income figures use 2025 Claritas estimates, permit figures use the U.S. Census Bureau Building Permits Survey, and population figures use 2025 Census estimates. The ranking itself was calculated and published in 2026.
The separate cost-of-living ranking uses Q1 2026 MERIC data. MERIC creates state-level indices by averaging results from participating cities and metropolitan areas in the C2ER Cost of Living Index. Because participation is voluntary, those figures should be understood as state-level comparisons based on participating markets rather than exhaustive measurements of every community.
These methodologies answer different questions, which is why this guide does not combine them into a homemade composite score.
Frequently Asked Questions About Housing Affordability in 2026
What is the most affordable state for housing in 2026?
Indiana ranks #1 overall in Realtor.com’s 2026 Affordability & Homebuilding Report Card, earning a score of 76.3 and an A grade. The ranking combines current home affordability with housing construction, so it measures both today’s conditions and whether states are adding enough housing to help meet future demand.
What state has the most affordable homes relative to income?
Iowa ranks first for pure home affordability. A median-priced home requires approximately 25.4% of Iowa’s median household income, the lowest share nationally in the 2026 report. Iowa also has the highest REALTORS® Affordability Score at 0.96.
What is the cheapest state to live in 2026?
Oklahoma has the lowest cost of living in MERIC’s Q1 2026 data, with an index of 83.5. Alabama ranks second at 85.0, followed by Mississippi at 86.2, Kansas at 87.6, West Virginia at 87.9, and Indiana at 88.3.
Which states have affordable homes for median-income buyers?
Using the 30% housing-cost threshold in Realtor.com’s analysis, median earners can afford median-priced homes in 11 states: Iowa, Illinois, Ohio, Kansas, Indiana, Michigan, Pennsylvania, West Virginia, Missouri, Maryland, and Minnesota.
Which state is least affordable for housing in 2026?
New York ranks last overall when affordability and homebuilding are considered together. It scores 8.5 out of 100 and receives an F. Its median listing price is $668,173, the median home requires approximately 55.2% of median household income, and residential permitting is low relative to the state’s population.
Are California and Hawaii still among the least affordable states?
Yes. California ranks #47 and Hawaii #48 in the 2026 overall ranking, and both receive F grades. Hawaii has the highest median listing price in the dataset at $767,360, while California’s is $742,305. However, New York and Massachusetts perform even worse overall once housing construction and other affordability measures are included.
Which regions have the most affordable housing?
The Midwest and South perform best overall. Every A and B grade in the 2026 Realtor.com report belongs to a state in one of those two regions. The Midwest performs particularly well on current affordability, while several Southern states stand out for strong residential construction.
Does the state with the cheapest houses automatically have the most affordable housing?
No. Home price alone does not account for household income, mortgage costs, taxes, insurance, or housing supply. A state can have cheap homes but low incomes, while another can have somewhat higher prices that are easier for local households to support. That is why this ranking separates home prices, affordability relative to income, cost of living, and housing construction.
References
- Realtor.com Economic Research: Grading the States, Affordability & Homebuilding Report Cards, 2026 Update.
- Realtor.com and National Association of Realtors: Housing Mismatch, A Look at the Alignment of For-Sale Listings and Incomes, 2026.
- Missouri Economic Research and Information Center: Cost of Living Data Series, First Quarter 2026.
- U.S. Census Bureau: Building Permits Survey.
- National Association of Realtors: Housing Affordability Index Methodology.