


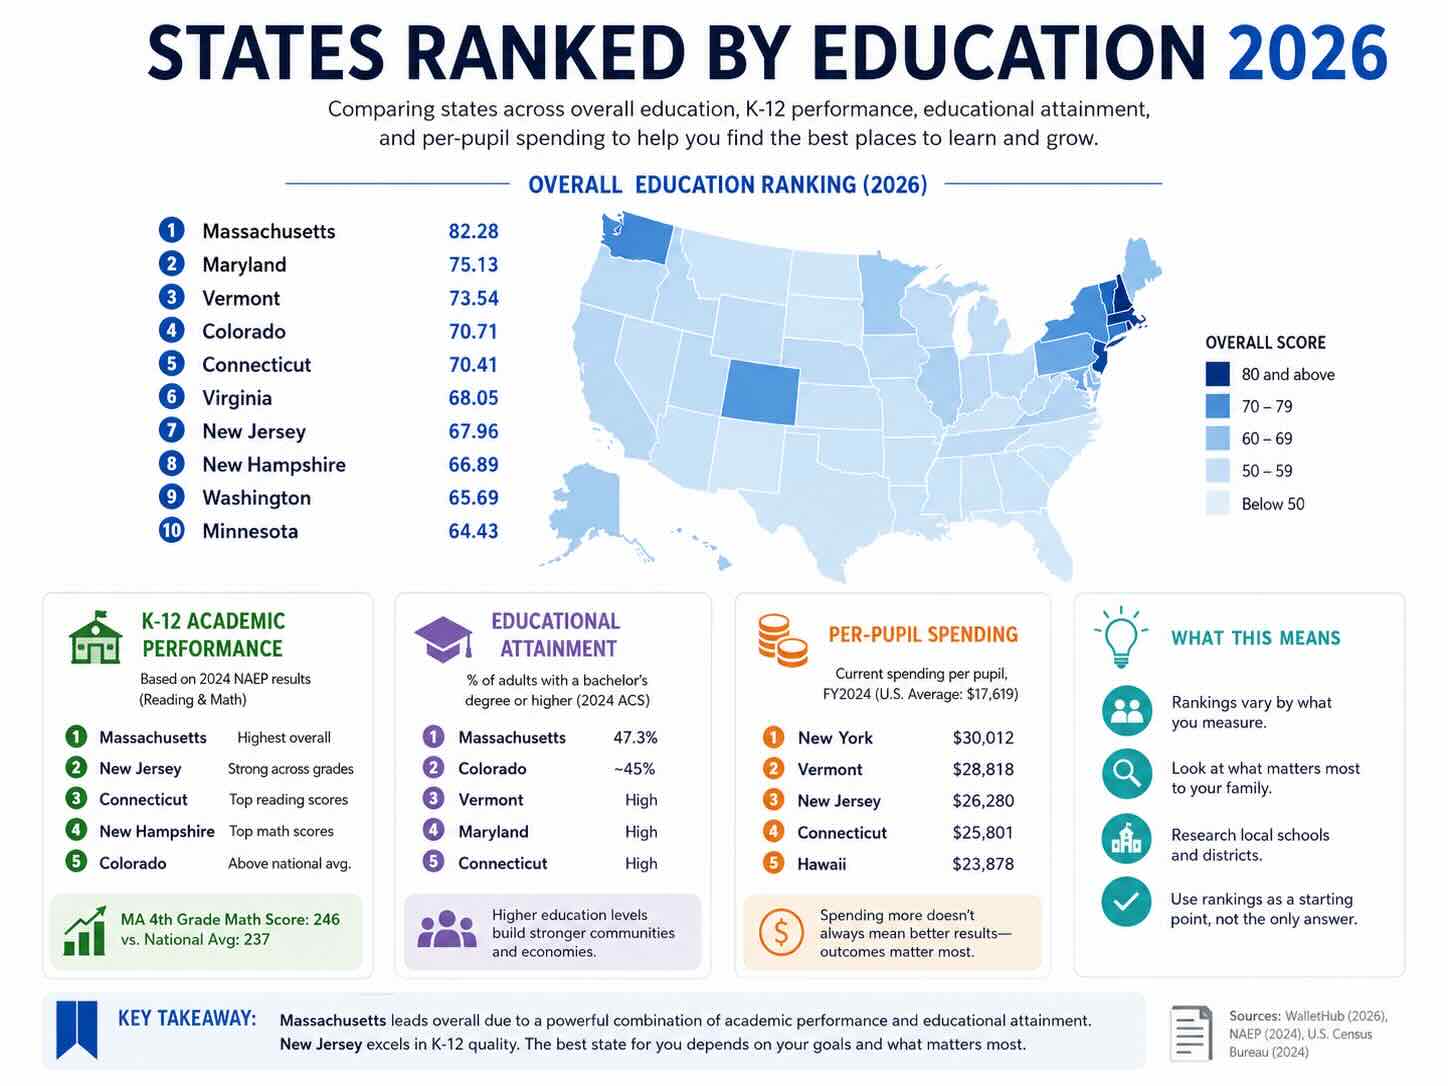
States ranked by education can produce very different answers depending on what “education” actually means. A family comparing public schools is asking a different question from an employer comparing the education level of state workforces, while a student choosing where to attend college may care more about higher education access, graduation outcomes, and affordability. That distinction matters in 2026 because there is no single official federal ranking that places every state from first to fiftieth across all of those measures.
Massachusetts has the strongest claim to the top tier when academic performance and educational attainment are considered together. It ranks first in WalletHub’s most-educated-state analysis, while the latest National Assessment of Educational Progress results show Massachusetts students among the country’s strongest performers in reading and mathematics. Maryland, Vermont, Colorado, Connecticut, Virginia, New Jersey, New Hampshire, Washington, and Minnesota complete WalletHub’s current top 10 for overall educational attainment and quality.
For families considering long-distance moving, however, the overall ranking should be treated as a starting point rather than a verdict on where a child will receive the best education. K-12 performance varies considerably within states, and school district, housing costs, local taxes, graduation outcomes, class sizes, and access to particular programs can matter more than a state’s national position.
Key Points: States Ranked by Education in 2026
- Most educated state overall: Massachusetts ranks #1 in WalletHub’s current state comparison, followed by Maryland, Vermont, Colorado, and Connecticut.
- K-12 academic performance: Massachusetts remains one of the clearest national leaders in the latest NAEP results, including an average grade-4 math score of 246 compared with 237 nationally and a grade-4 reading score of 225 compared with 214 nationally.
- Educational attainment is different from school quality: Rankings of the “most educated states” combine the education levels of adults with measures of educational quality. They should not be interpreted as a simple ranking of public school systems.
- Spending has increased substantially: U.S. public schools spent an average of $17,619 per pupil in FY2024, up 6.6% from $16,526 one year earlier.
- There is no official federal #1 education state: Census, NCES and NAEP publish underlying education statistics rather than one universal state league table. Rankings depend on which metrics are selected and how heavily each is weighted.
States Ranked by Education in 2026: Overall Ranking
For a broad comparison of education across states, one of the most useful approaches is to combine educational attainment with educational quality. This prevents a state from ranking highly simply because a large percentage of its adult residents have degrees while its current school system performs poorly, or because its schools perform well while relatively few adults have completed higher education.
WalletHub’s current Most Educated States analysis uses that approach. Its overall ranking places Massachusetts first with a score of 82.28, followed by Maryland at 75.13, Vermont at 73.54, Colorado at 70.71, and Connecticut at 70.41. Virginia, New Jersey, New Hampshire, Washington, and Minnesota round out the top 10.
| Overall Rank | State | Overall Score | Educational Attainment Rank | Quality of Education Rank |
|---|---|---|---|---|
| 1 | Massachusetts | 82.28 | 1 | 1 |
| 2 | Maryland | 75.13 | 4 | 2 |
| 3 | Vermont | 73.54 | 3 | 14 |
| 4 | Colorado | 70.71 | 2 | 33 |
| 5 | Connecticut | 70.41 | 5 | 6 |
| 6 | Virginia | 68.05 | 7 | 11 |
| 7 | New Jersey | 67.96 | 10 | 4 |
| 8 | New Hampshire | 66.89 | 6 | 17 |
| 9 | Washington | 65.69 | 9 | 12 |
| 10 | Minnesota | 64.43 | 8 | 22 |
This table immediately reveals why a single education ranking needs context. Colorado is fourth overall largely because of its exceptionally educated population, ranking second for educational attainment, while its quality component ranks much lower. New Jersey presents almost the opposite profile: it ranks tenth for attainment but fourth for educational quality. Both are highly educated states, but they reach their overall positions for different reasons.
What Does “States Ranked by Education” Actually Measure?
Education rankings generally combine statistics that belong to several different categories. Treating them as interchangeable can produce misleading conclusions.
K-12 academic performance measures what students are demonstrating in subjects such as mathematics and reading. The National Assessment of Educational Progress, commonly called NAEP or the Nation’s Report Card, is particularly valuable here because it provides a common assessment that allows performance to be compared across participating states and jurisdictions.
Educational attainment measures how far adults have progressed through formal education. Statistics such as the percentage of adults with a high school diploma, bachelor’s degree, graduate degree, or professional degree describe the education of a state’s population rather than the current performance of its public schools.
School-system resources include per-pupil expenditures, instructional spending, teacher compensation and other financial measures. Spending provides important context, but more spending does not automatically produce better academic outcomes.
Higher education introduces another set of questions involving college access, tuition, completion rates, student debt, university quality and the share of residents who earn degrees.
A state can therefore be excellent in one dimension and relatively ordinary in another. That is why this guide keeps the overall, K-12, attainment and spending comparisons separate rather than presenting several unrelated rankings as though they measure the same thing.
States Ranked by Education K-12: What the Latest NAEP Results Show
The K-12 portion of this comparison deserves particular attention because it matches a different search intent from the broader “most educated states” question. Families researching where to raise children are usually more interested in current student performance than in the percentage of adults who arrived in the state already holding college degrees.
The latest state-comparable NAEP results were released for 2024. Massachusetts stands out across both reading and mathematics. Fourth-grade students in Massachusetts recorded an average mathematics score of 246, nine points above the national public-school average of 237. In reading, Massachusetts fourth graders averaged 225, eleven points above the national public-school average.
The advantage remains visible later in a student’s education. Massachusetts eighth graders averaged 268 in reading, compared with 257 nationally, while its eighth-grade mathematics score reached 283, approximately eleven points above the national public-school result.
New Jersey also performs strongly. Its fourth-grade reading score of 222 was among the highest state results, while eighth graders averaged 266 in reading and 282 in mathematics. Connecticut, New Hampshire, Colorado, Minnesota, Wisconsin, Utah and several other states also appear near the upper end of individual NAEP subjects and grades.
That last qualification matters. NAEP does not publish a simplistic official “best K-12 state” ranking combining every subject and grade into a single score. A state may rank especially well in fourth-grade reading but differently in eighth-grade mathematics. For that reason, the most defensible K-12 comparison examines performance across several assessments instead of declaring a national winner from one test.
Why Massachusetts Is a K-12 Education Leader
Massachusetts is unusual because its strength is visible across multiple stages of education rather than depending on one standout statistic. In the 2024 NAEP assessment, 51% of Massachusetts fourth graders performed at or above the NAEP Proficient level in mathematics, compared with an average score of 246 for the state. In reading, 40% reached or exceeded Proficient.
Among eighth graders, Massachusetts recorded a reading score of 268 and mathematics score of 283. Those results put the state well above the national public-school averages in both subjects.
That consistency is more informative than simply saying Massachusetts has “good schools.” It indicates that the state’s advantage can be observed in elementary mathematics, elementary reading and middle-school performance using the same national assessment framework.
It also helps explain why Massachusetts performs so well in broader education rankings. A highly educated adult population exists alongside strong contemporary K-12 results, meaning its position is not based solely on the presence of universities or the migration of college-educated workers into Greater Boston.
New Jersey Combines Strong K-12 Results With High Educational Quality
New Jersey provides another useful example of why the sub-rankings matter. It places seventh in WalletHub’s overall ranking, but rises to fourth on the study’s education-quality dimension. The latest NAEP results provide additional evidence for that strength.
New Jersey fourth graders averaged 222 in reading in 2024. At eighth grade, the state’s average reading score reached 266, nine points above the national public-school average, while eighth-grade mathematics reached 282. Thirty-eight percent of New Jersey eighth graders performed at or above NAEP Proficient in reading, and 37% reached that threshold in mathematics.
For a family comparing Massachusetts and New Jersey, therefore, an overall #1 versus #7 ranking hides much of the useful information. Massachusetts has the stronger overall combination of attainment and educational quality in WalletHub’s methodology, but New Jersey’s current K-12 performance remains among the strongest in the country.
Which States Have the Most Educated Populations?
“Most educated state” answers a different question. It measures the educational characteristics of adults living in a state, which can reflect decades of schooling, economic development and interstate migration.
WalletHub’s educational-attainment dimension ranks Massachusetts first, Colorado second, Vermont third, Maryland fourth and Connecticut fifth. New Hampshire, Virginia, Minnesota, Washington and New Jersey complete the top 10 on that dimension.
These rankings are useful when comparing workforce characteristics and the broader educational environment of a state. They are less useful when a parent wants to know whether the elementary school near a particular home performs well.
Colorado illustrates the distinction particularly clearly. It ranks second for educational attainment and fourth overall, but only 33rd on WalletHub’s quality-of-education component. The state has an exceptionally educated adult population, but that fact should not be converted into a claim that Colorado has America’s second-best K-12 schools.
New Jersey again shows the reverse pattern. It ranks tenth for attainment but fourth for educational quality. The difference demonstrates why both metrics deserve their own sections rather than being compressed into one “education” score without explanation.
How Much Do States Spend on Public Education?
School funding is another important part of the education picture, but the latest federal data require an update to many figures commonly repeated in state-ranking articles.
According to the U.S. Census Bureau’s Annual Survey of School System Finances released in May 2026, public elementary and secondary schools spent an average of $17,619 per pupil in fiscal year 2024. That was a 6.6% increase from $16,526 in FY2023.
Total expenditures by public elementary-secondary school systems reached $983.7 billion. Current spending accounted for $842.3 billion, while capital outlays totaled $113.1 billion. Instruction represented $495.0 billion, or 58.8% of current spending, and instructional salaries alone accounted for $291.8 billion.
| U.S. Public School Finance Measure | Latest FY2024 Figure |
|---|---|
| Average current spending per pupil | $17,619 |
| Previous year | $16,526 |
| Annual increase | 6.6% |
| Total public elementary-secondary expenditures | $983.7 billion |
| Current spending | $842.3 billion |
| Instruction expenditures | $495.0 billion |
| Instructional salaries | $291.8 billion |
These figures are particularly important for a 2026 article because the year attached to an education ranking is not necessarily the year in which the underlying data were collected. The newest complete federal school-finance dataset available in 2026 describes FY2024. Labeling those figures clearly is more accurate than presenting them as spending that occurred during the 2026 school year.
Does Spending More Per Student Produce Better Schools?
Higher spending can provide districts with resources for teacher salaries, specialized staff, facilities, transportation, technology, special education and student support, but spending by itself is not an academic-performance ranking.
Two states can spend similar amounts per student and produce different outcomes because costs, student populations, staffing structures, district organization and regional wages differ. The Census Bureau also cautions that its state spending statistics are not adjusted for inflation or differences in the cost of living between geographic areas.
That is especially important when comparing high-cost Northeastern states with lower-cost states. A dollar of school expenditure does not purchase exactly the same quantity of labor, property or services in Massachusetts, New York, Mississippi and Oklahoma.
For that reason, spending works best as a contextual measure. It tells us about the financial resources flowing through a school system. NAEP and other outcome measures tell us much more directly what students are demonstrating academically.
Why Education Rankings by State Give Different Answers
It is entirely possible for Massachusetts, New Jersey or another state to be called the “best state for education” by different publications without one ranking necessarily being wrong. The disagreement usually begins with methodology.
A ranking that heavily weights bachelor’s-degree attainment will favor states with large concentrations of highly educated professionals. A K-12 ranking emphasizing standardized assessments can produce a different order. A higher-education ranking may favor states with affordable public universities and strong graduation outcomes. A school-finance comparison may put states with the highest expenditures near the top even when their academic outcomes are less exceptional.
The year labels add another layer of confusion. A ranking published in 2026 can legitimately use the newest available NAEP results from 2024, Census financial data from FY2024, ACS educational-attainment estimates from 2024, and other datasets released on different schedules. “2026 ranking” therefore usually describes when the comparison was assembled, not when every underlying observation occurred.
For readers, the better question is not simply “Which ranking is correct?” It is “Which ranking measures the thing I actually care about?”
Massachusetts vs. New Jersey: Which Has the Better Education System?
If the comparison is broad educational strength, Massachusetts has the stronger overall case. It ranks first in WalletHub’s overall study, first for educational attainment and first for educational quality. Its latest NAEP results are also exceptional, including the nation’s highest state-level grade-4 reading score and performance near the top of the distribution in mathematics and eighth-grade reading.
New Jersey nevertheless belongs in the same national tier for K-12 education. Its eighth-grade reading and mathematics scores substantially exceed the national public-school averages, and WalletHub ranks it fourth for educational quality.
The practical distinction matters more than deciding which state deserves a trophy. Massachusetts combines an exceptionally educated adult population with consistently strong school outcomes. New Jersey’s overall attainment ranking is somewhat lower, but its school-quality measures remain extremely competitive.
What Families Should Consider Beyond State Education Rankings
A state ranking is useful when narrowing a national search, but it becomes less useful as the decision gets more local. Public education in the United States is delivered through districts and individual schools, and the differences inside one state can be enormous.
A family comparing possible destinations should look at the specific district serving the property, recent school performance, graduation rates, advanced-course availability, special education resources, extracurricular programs, transportation, student-to-teacher conditions and whether district boundaries are likely to change. Housing prices also matter because access to highly sought-after districts can carry a substantial real-estate premium.
The same principle applies when comparing states. Massachusetts may perform exceptionally well overall, but that does not mean every Massachusetts school is superior to every school in Colorado, New Jersey, Virginia or Minnesota. State rankings describe broad systems. Families ultimately enroll children in individual schools.
Which Education Ranking Matters Most if You Are Moving?
For households deciding where to move, the most relevant ranking depends on who is moving and why.
- Families with school-age children: Start with K-12 academic outcomes, then compare the actual districts and schools associated with potential homes.
- Families with college-bound teenagers: Consider K-12 preparation alongside in-state university options, tuition policies and financial aid.
- College graduates choosing a job market: Educational attainment can reveal where highly educated workforces and knowledge-intensive industries are concentrated.
- Retirees or households without children: Education may matter indirectly through property values, taxes and community characteristics rather than school access itself.
- Households comparing affordability: Consider education together with housing prices and taxes rather than assuming the highest-ranked state automatically provides the best value.
This is also where national education rankings become useful to a moving decision rather than simply an interesting list. The best state on paper may not provide the best combination of schools, employment, housing costs and lifestyle for a particular household.
Frequently Asked Questions About States Ranked by Education
What state ranks #1 in education in 2026?
There is no official federal #1 state for education because education rankings use different methodologies. Massachusetts ranks first in WalletHub’s broad most-educated-state comparison and also performs exceptionally well in the latest NAEP K-12 assessments. Different rankings focused exclusively on K-12 schools, higher education, affordability or spending can produce a different #1 state.
What are the top 10 states for education?
Using WalletHub’s combined educational attainment and quality methodology, the top 10 are Massachusetts, Maryland, Vermont, Colorado, Connecticut, Virginia, New Jersey, New Hampshire, Washington and Minnesota. That ranking should be distinguished from a pure K-12 school-performance ranking.
Which state has the best K-12 education?
Massachusetts has one of the strongest evidence-based claims based on the latest NAEP results. Massachusetts students scored above the national public-school average in grade-4 reading and mathematics and grade-8 reading and mathematics in 2024. However, NAEP reports subject and grade results rather than publishing one official composite ranking of all state K-12 systems.
Which states perform best in K-12 education?
Massachusetts and New Jersey appear near the top across several of the latest NAEP reading and mathematics comparisons. Connecticut, New Hampshire, Colorado, Minnesota, Wisconsin, Utah and other states also perform strongly in particular grades and subjects. The order changes depending on whether the comparison uses reading, mathematics, grade 4 or grade 8.
What is the difference between the most educated state and the state with the best schools?
A “most educated state” ranking usually considers how much formal education adults have completed, including high school, bachelor’s and graduate degrees. A school-quality ranking measures the current education system using factors such as student performance and other school outcomes. A state can therefore have a highly educated population without having the country’s highest-performing K-12 system.
How much does the United States spend per public school student?
The U.S. Census Bureau reports average current spending of $17,619 per public-school pupil in fiscal year 2024, the newest complete national school-finance data released in 2026. That represented a 6.6% increase from $16,526 in FY2023.
Are education rankings important when choosing where to live?
They are useful for comparing broad state education environments, but they should not replace local school research. Families generally benefit from using a state ranking to narrow their options and then comparing districts, individual schools, housing costs, taxes, programs and student outcomes in the communities where they could actually live.
References and Data Sources
- National Assessment of Educational Progress (NAEP): Massachusetts State Profile and 2024 Results
- National Assessment of Educational Progress (NAEP): New Jersey State Profile and 2024 Results
- U.S. Census Bureau: Public School Spending Per Pupil Reaches Historic High in 2024, released May 2026
- U.S. Census Bureau: 2024 Public Elementary-Secondary Education Finance Data
- WalletHub: Most & Least Educated States in America
- U.S. Census Bureau: American Community Survey Educational Attainment Data