


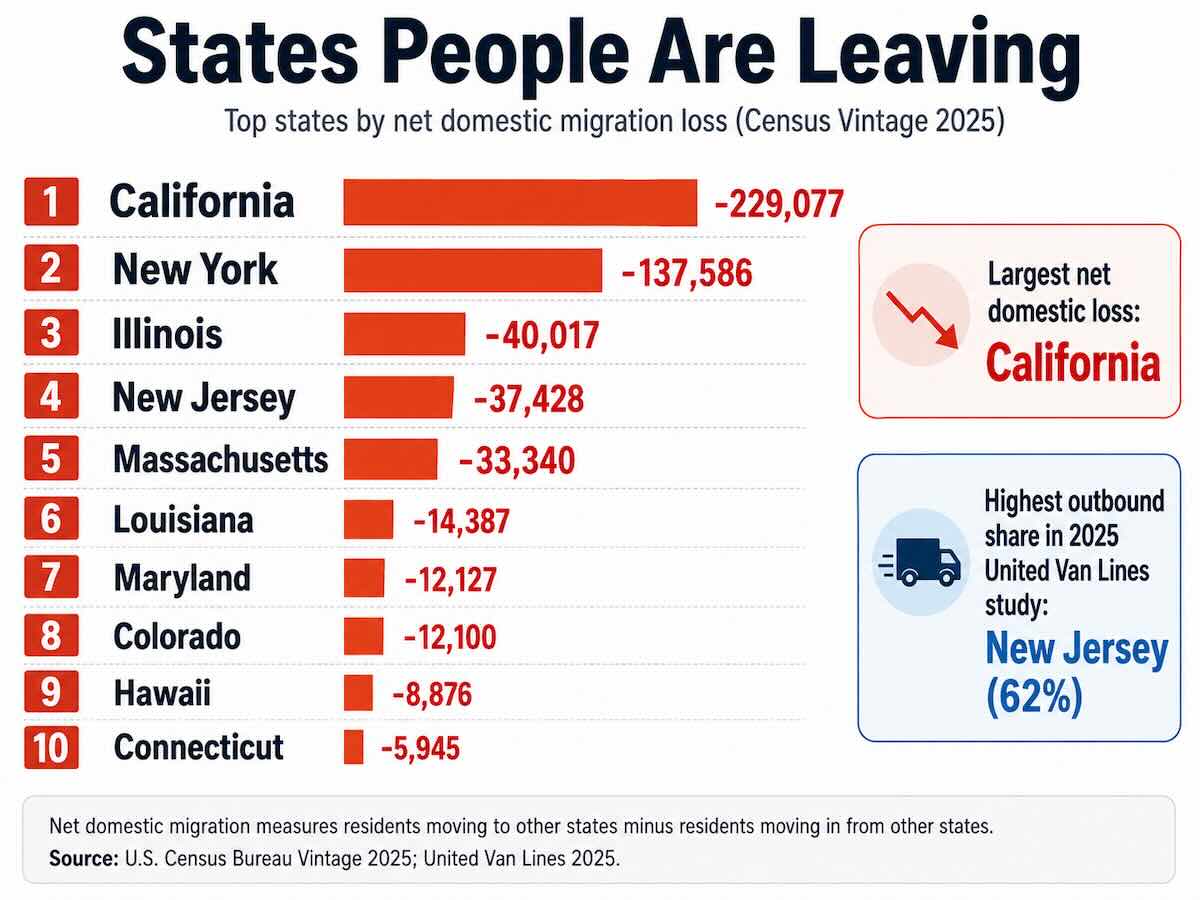
California currently has the largest net domestic migration loss of any state. U.S. Census Bureau estimates show California lost a net 229,077 residents to other states between July 2024 and July 2025. New York had the second-largest net domestic migration loss at 137,586.
There is another way to answer the question, however. The latest American Community Survey estimated that about 661,205 people moved from California to another state during 2024, the largest gross interstate departure total in the country. Meanwhile, United Van Lines ranked New Jersey as its highest-outbound state in 2025, with 62% of the interstate household moves it handled going out of the state.
Those numbers measure different things. This report separates total departures, net domestic migration, and moving-company outbound percentages so you can see which states people are leaving without mixing incompatible rankings.
Key Points (2026)
- Largest net domestic migration loss: California, at -229,077 residents from July 2024 to July 2025.
- Second-largest net loss: New York, at -137,586.
- Most people moving out in gross volume: California, with an estimated 661,205 residents moving to another state during 2024.
- Highest outbound share in the 2025 United Van Lines study: New Jersey at 62% outbound, followed by New York and California at 58%.
- U-Haul’s largest 2025 net loss: California ranked 50th on the U-Haul Growth Index for the sixth consecutive year.
- Why Americans move: United Van Lines’ 2025 survey found proximity to family was the most commonly reported reason at 29%, followed by a new job or company transfer at 26% and retirement at 14%.
Which State Has the Most People Leaving?
California is the clearest answer when official Census data are used. It has both the largest recent net domestic migration loss and the largest number of gross interstate departures in the latest available Census datasets.
The answer changes when a private moving company’s customer base is measured instead. United Van Lines ranked New Jersey first for outbound share in 2025. That does not contradict the Census result because United measures the percentage of its own interstate household moves leaving a state rather than every person who moves.
| Question | Measurement | Current Leader | Latest Data |
|---|---|---|---|
| Which state is losing the most residents to other states? | Net domestic migration | California: -229,077 | Census Vintage 2025 |
| Which state had the most people physically move out? | Gross interstate departures | California: 661,205 | 2024 ACS |
| Which state had the highest outbound professional-mover share? | United Van Lines customer moves | New Jersey: 62% outbound | 2025 |
| Which state had the largest DIY mover imbalance? | Net one-way U-Haul customers | California: #50 | 2025 |
Sources: U.S. Census Bureau American Community Survey 2024 State-to-State Migration Flows; U.S. Census Bureau Vintage 2025 Population Estimates; United Van Lines 2025 National Movers Study; U-Haul 2025 Growth Index.
What States Are People Moving Out Of?
Net domestic migration is the most useful Census measure when the question is whether a state is losing more residents to other states than it gains from them. It subtracts domestic arrivals from domestic departures.
California and New York stand well apart from the rest of the country on this measure. California recorded a net domestic loss of 229,077 residents between July 2024 and July 2025, while New York lost 137,586. Illinois, New Jersey, and Massachusetts formed the next group of high-loss states.
| Rank | State | Net Domestic Migration | Total Population Change |
|---|---|---|---|
| 1 | California | -229,077 | -9,465 |
| 2 | New York | -137,586 | +1,008 |
| 3 | Illinois | -40,017 | +16,108 |
| 4 | New Jersey | -37,428 | +41,861 |
| 5 | Massachusetts | -33,340 | +15,524 |
| 6 | Louisiana | -14,387 | +3,311 |
| 7 | Maryland | -12,127 | +20,033 |
| 8 | Colorado | -12,100 | +24,059 |
| 9 | Hawaii | -8,876 | -2,132 |
| 10 | Connecticut | -5,945 | +14,047 |
Source: U.S. Census Bureau, Vintage 2025 Population Estimates. Net domestic migration covers July 1, 2024 through June 30, 2025. Total population change covers July 1, 2024 through July 1, 2025.
The population-change column explains why net domestic migration should not be confused with total population decline. New Jersey lost 37,428 more domestic residents than it gained, for example, yet its overall population increased by 41,861. Births and international migration can offset domestic losses.
Which States Had the Most People Move Out in Total?
The American Community Survey provides another useful measurement: the estimated number of residents who lived in a state one year earlier and then moved to a different state.
By this gross departure measure, California again ranks first. About 661,205 people moved from California to another state during 2024. Florida and Texas also recorded very large departure totals, which shows why gross movement should not automatically be interpreted as population loss. Large states can have hundreds of thousands of residents moving both in and out during the same year.
| Rank | State | Residents Moving to Another State |
|---|---|---|
| 1 | California | 661,205 |
| 2 | Florida | 506,246 |
| 3 | Texas | 483,476 |
| 4 | New York | 415,449 |
| 5 | Illinois | 282,796 |
| 6 | Virginia | 263,931 |
| 7 | Pennsylvania | 251,701 |
| 8 | North Carolina | 241,195 |
| 9 | Georgia | 229,471 |
| 10 | New Jersey | 214,762 |
Source: U.S. Census Bureau, 2024 American Community Survey 1-Year State-to-State Migration Flows. Estimates are based on a sample and are subject to margins of error.
What Are the Top Outbound States According to Moving-Company Data?
United Van Lines provides a different view because it tracks interstate household moves handled by the UniGroup network. Its 2025 study classified a state as high outbound when at least 55% of qualifying moves were leaving the state.
New Jersey ranked first in 2025 at 62% outbound. New York and California followed at 58%. North Dakota, Colorado, Mississippi, and Massachusetts also met United’s high-outbound threshold.
| Rank | State | 2025 United Van Lines Result |
|---|---|---|
| 1 | New Jersey | 62% outbound |
| 2 | New York | 58% outbound |
| 3 | California | 58% outbound |
| 4 | North Dakota | High outbound, 55%+ |
| 5 | Colorado | High outbound, 55%+ |
| 6 | Mississippi | High outbound, 55%+ |
| 7 | Massachusetts | High outbound, 55%+ |
United’s sample is useful for identifying the direction of full-service household moves, but it is not a census of every mover. Its 2025 ranking includes states with at least 250 qualifying moves and does not include Alaska or Hawaii.
One important change is Illinois. After appearing repeatedly in earlier outbound studies, United classified Illinois as balanced in 2025. Census estimates still show a net domestic loss of 40,017, so the two sources tell different but compatible stories about different groups of movers.
Which States Are Losing the Most DIY Movers?
U-Haul’s Growth Index adds another perspective by comparing one-way trucks, trailers, and U-Box containers arriving in and leaving each state. The company analyzes more than 2.5 million annual one-way transactions across the United States and Canada.
California finished at the bottom of the 2025 index for the sixth consecutive year, meaning it had the largest net loss of U-Haul one-way customers. Illinois, New Jersey, New York, and Massachusetts completed the bottom five.
| 2025 U-Haul Rank | State | Direction |
|---|---|---|
| 46 | Massachusetts | Net-loss state |
| 47 | New York | Net-loss state |
| 48 | New Jersey | Net-loss state |
| 49 | Illinois | Net-loss state |
| 50 | California | Largest net loss |
U-Haul cautions that its Growth Index does not directly equal population growth. It measures its own one-way customer transactions, so it is best used as another signal alongside Census data.
Why Are People Leaving These States?
No single explanation applies to every household. United Van Lines found that the most common reasons reported by its 2025 interstate customers were moving closer to family, a new job or company transfer, and retirement. Housing affordability and lifestyle preferences also influence where many households ultimately choose to live.
Are People Leaving California?
Yes. California shows the strongest outbound pattern across the major datasets. Census Vintage 2025 estimates a net domestic migration loss of 229,077. The 2024 ACS also estimates that 661,205 Californians moved to another state, the largest gross departure total in the country.
California was 58% outbound in the United Van Lines 2025 study and ranked 50th on the 2025 U-Haul Growth Index. The agreement across official population data, full-service moving-company data, and DIY moving data makes California’s outbound trend unusually clear.
The largest California migration route in the latest ACS data was California to Texas, with an estimated 77,161 movers. Nevada received about 53,289 former California residents, Arizona 52,383, Washington 43,938, and Florida 36,194.
For households considering one of these interstate routes, our moving cost calculator can help turn a migration trend into a more practical moving budget.
Why Are People Leaving New York?
New York recorded the second-largest net domestic migration loss, at 137,586 residents between July 2024 and July 2025. The ACS estimates that 415,449 New York residents moved to another state during 2024.
New York also ranked second in the United Van Lines outbound study at 58% and 47th on the U-Haul Growth Index. The latest Census flow data show that New Jersey was the largest destination for New Yorkers, receiving an estimated 56,799 residents. Florida followed at 50,661, then Pennsylvania at 29,274 and Texas at 28,233.
New York still gained population overall in the latest Census estimate period because international migration and natural population change offset its domestic migration loss. That distinction is important when interpreting headlines about people leaving the state.
Why Are People Leaving New Jersey?
New Jersey is the clearest example of why outbound percentage and total migration volume need to be separated. It ranked only fourth in Census net domestic losses, at -37,428, but United Van Lines ranked it the country’s highest-outbound state at 62% of its qualifying 2025 moves.
United has placed New Jersey among its 10 highest-outbound states for more than 15 years. Its latest study also found a generational split: 21% of inbound New Jersey moves involved people ages 18 to 34, while the state continued to lose retirees. United described New Jersey as a possible “launch state” for younger adults starting careers even while older households move elsewhere.
The ACS shows Pennsylvania as the largest destination for New Jersey residents in 2024, with about 38,467 movers. New York received 36,002 and Florida received 22,646.
Is Illinois Still a State People Are Leaving?
Census data still show more domestic residents leaving Illinois than entering. Its latest net domestic migration loss was 40,017, the third-largest state loss in Vintage 2025.
Other indicators are changing, though. United Van Lines classified Illinois as balanced in 2025 for the first time in more than a decade. U-Haul placed Illinois 49th, making it one of its strongest net-loss states. The difference is another reminder that each dataset represents a different segment of movers.
The 2024 ACS estimates that 282,796 Illinois residents moved to another state. The largest flows went to Indiana, Florida, Wisconsin, and Texas.
Are People Leaving Massachusetts?
Massachusetts had a net domestic migration loss of 33,340 in the latest Census estimates. It also ranked seventh on United Van Lines’ 2025 outbound list and 46th on the U-Haul Growth Index.
The ACS estimates that 182,947 Massachusetts residents moved to another state during 2024. Florida received about 21,834, New Hampshire 20,310, New York 17,862, and California 15,720.
Why Do North Dakota, Colorado, and Mississippi Appear on Outbound Lists?
These states demonstrate why a moving-company ranking cannot be treated as a population-loss ranking. United Van Lines placed North Dakota fourth, Colorado fifth, and Mississippi sixth among its high-outbound states for 2025.
Census data tell a more nuanced story. Colorado had a net domestic migration loss of 12,100, while Mississippi was close to balanced at a loss of 917. North Dakota actually recorded a small net domestic migration gain of 512 residents.
United’s results therefore indicate that a large share of the qualifying moves it handled in those states were outbound. They do not mean North Dakota or Mississippi lost more domestic residents overall than states such as Illinois, New Jersey, or Massachusetts.
Where Are People Moving When They Leave?
The latest ACS flows show that state-to-state movement tends to follow several large corridors. California to Texas remains the country’s largest individual interstate flow among the states, although its latest estimate is lower than some figures reported from earlier years.
| Route | Estimated Movers in 2024 |
|---|---|
| California → Texas | 77,161 |
| New York → New Jersey | 56,799 |
| California → Nevada | 53,289 |
| California → Arizona | 52,383 |
| New York → Florida | 50,661 |
Source: U.S. Census Bureau, 2024 ACS State-to-State Migration Flows. Estimates are subject to sampling error and should not be interpreted as exact administrative counts.
Why Do People Move Out of State?
Migration statistics tell us where people go, but the reasons behind an individual move vary. United Van Lines’ 2025 customer survey found three motivations ahead of the rest: being closer to family at 29%, a company transfer or new job at 26%, and retirement at 14%.
Affordability also matters when households compare destinations. Housing costs can determine whether a family can buy a home, downsize comfortably, or remain near a major employment center. That does not mean every person leaving California, New York, New Jersey, or Massachusetts is moving because of housing costs. It means affordability is one factor that can influence the destination once a household has a reason to move.
Retirement creates another recognizable pattern. A household no longer tied to an employer can place greater weight on climate, housing costs, taxes, healthcare access, family proximity, and lifestyle. Job-related moves work differently because the destination may be largely determined by the employer or by where suitable work is available.
Readers comparing the financial side of different destinations can also review our state housing affordability rankings.
How We Measure States People Are Leaving
The phrase “states people are leaving” sounds simple, but several measurements can answer it. We use each one only for the question it can support.
- Gross interstate departures: the number of people who lived in one state a year earlier and now live in another state. The latest complete Census state-to-state flow table comes from the 2024 American Community Survey.
- Net domestic migration: people moving into a state from another state minus people moving out to another state. A negative number means the state lost more domestic residents than it gained. Our current ranking uses Census Vintage 2025 estimates covering July 2024 through June 2025.
- Total population change: includes domestic migration, international migration, births, and deaths. A state can therefore lose domestic residents while its total population still increases.
- United Van Lines outbound percentage: the percentage of qualifying interstate household moves handled by the UniGroup network that were outbound. United classified states with 55% or more outbound moves as high outbound in 2025.
- U-Haul Growth Index: ranks states according to net gains or losses of one-way U-Haul truck, trailer, and U-Box customers. It primarily reflects the DIY moving segment and does not directly measure state population change.
Because these methods answer different questions, we do not combine them into one artificial score. Agreement across several sources can strengthen evidence of an outbound pattern, while disagreement can reveal that different types of movers are behaving differently.
Planning an Interstate Move?
If these migration patterns match a move you are already considering, the more useful next question is what your specific move could cost. Distance, shipment size, packing, access conditions, and the time of year can all change the price.
Use our moving cost calculator to build a planning range, or review our long-distance moving guide for an overview of interstate moving timelines, estimates, and delivery.
Coastal Moving Services is a moving broker that arranges interstate household-goods transportation with authorized motor carriers. The assigned carrier performs the physical transportation.
Frequently Asked Questions
What states are people moving out of the most?
California and New York currently have the largest net domestic migration losses in official Census estimates. California lost a net 229,077 residents to other states between July 2024 and July 2025, while New York lost 137,586. Illinois, New Jersey, and Massachusetts were next.
Which state has the most people leaving?
California has the strongest claim based on Census data. It had the largest net domestic migration loss in Vintage 2025 and the largest gross interstate departure total in the 2024 American Community Survey. An estimated 661,205 California residents moved to another state during 2024.
What state has the highest outbound migration rate?
Among states included in United Van Lines’ 2025 National Movers Study, New Jersey had the highest outbound share at 62%. New York and California followed at 58%. This percentage covers United Van Lines customer moves and should not be interpreted as the percentage of the entire state population that moved away.
What are the top states people are leaving?
By latest Census net domestic migration loss, the top five are California, New York, Illinois, New Jersey, and Massachusetts. United Van Lines’ 2025 high-outbound list instead begins with New Jersey, New York, California, North Dakota, and Colorado because it ranks states by outbound share within its own moving network.
Are people still leaving California?
Yes. California lost a net 229,077 domestic residents in the latest Census estimate period. It was also 58% outbound in United Van Lines’ 2025 study and ranked last on U-Haul’s 2025 Growth Index. The ACS estimated 661,205 California residents moved to another state during 2024.
Where are Californians moving?
Texas was the largest destination for Californians in the 2024 ACS, receiving an estimated 77,161 people. Nevada received about 53,289, Arizona 52,383, Washington 43,938, and Florida 36,194.
Are people still leaving New York?
New York continues to have substantial domestic out-migration. Its latest net domestic loss was 137,586. However, New York’s total population increased slightly during the same estimate cycle because international migration and natural population change offset the domestic loss.
Why does New Jersey rank first on some lists but California ranks first on others?
The rankings use different measurements. California leads Census measures of gross interstate departures and net domestic migration loss. New Jersey leads the United Van Lines ranking because 62% of the qualifying interstate moves handled by its network in New Jersey were outbound.
Is Illinois still losing residents?
Illinois recorded a net domestic migration loss of 40,017 in Census Vintage 2025, although its total population increased by 16,108. United Van Lines classified Illinois as balanced in 2025, while U-Haul ranked it 49th on its Growth Index. The sources therefore show that Illinois still has domestic migration pressure, but the pattern varies across mover types.
Does outbound migration mean a state’s population is shrinking?
No. A state can lose residents to other states and still grow overall. New Jersey, Massachusetts, Illinois, New York, and several other states recorded net domestic migration losses while their total populations increased because international migration and natural population change offset those losses.
References
- U.S. Census Bureau: State-to-State Migration Flows, 2024 American Community Survey
- U.S. Census Bureau: 2024 State-to-State Migration Flows Statistics Now Available
- U.S. Census Bureau: State Population Totals and Components of Change, Vintage 2025
- U.S. Census Bureau: U.S. Population Growth Slows, Vintage 2025
- United Van Lines: 2025 National Movers Study
- U-Haul: 2025 Growth Index