

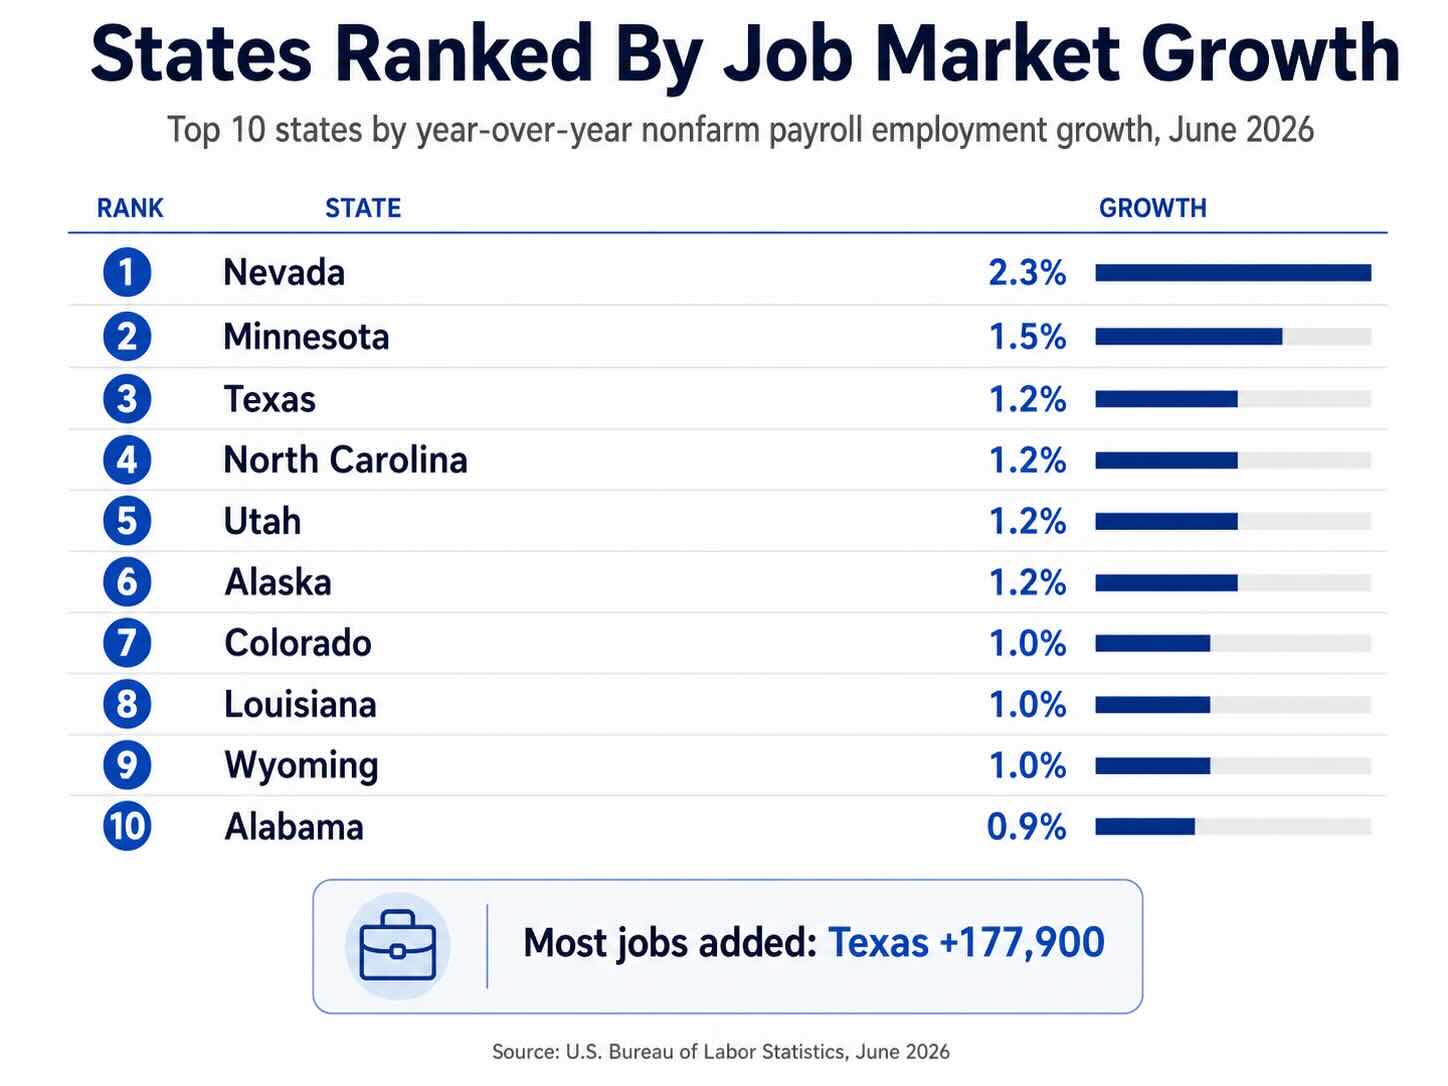
Nevada has the fastest-growing job market by payroll employment in the latest 2026 state data, with nonfarm employment up 2.3% from June 2025 to June 2026. Minnesota ranks second at 1.5%, while Texas, North Carolina, Utah, and Alaska each grew by 1.2%.
Texas tells the other half of the story. Its percentage growth is lower than Nevada’s, but Texas added approximately 177,900 jobs over the year, by far the largest numerical increase of any state. California added about 106,900 jobs despite growing only 0.6%, while North Carolina added 62,900 and Minnesota added 45,900.
That distinction matters if you are using job growth to decide where to move. A smaller state can rank highly because a relatively modest number of new positions represents a large percentage of its existing workforce. A large state may rank lower by percentage while creating far more actual jobs.
This 2026 ranking uses the latest seasonally adjusted state nonfarm payroll employment data from the U.S. Bureau of Labor Statistics, comparing June 2026 with June 2025. All 50 states are ranked by percentage employment growth, with ties broken by the number of net jobs added. We also compare unemployment rates, identify which changes BLS considers statistically significant, and explain what the numbers actually mean for someone considering a career move.
Key Points: State Job Growth in 2026
- Nevada ranks No. 1: Nonfarm payroll employment increased 2.3% from June 2025 to June 2026, adding approximately 36,700 jobs.
- Minnesota ranks No. 2: Employment increased 1.5%, representing roughly 45,900 additional jobs.
- Texas added the most jobs: Texas employment grew 1.2%, but its enormous labor market translated that into approximately 177,900 additional jobs.
- North Carolina is another standout: Employment increased 1.2%, with approximately 62,900 jobs added and a June unemployment rate of 3.6%.
- Utah and Alaska also grew 1.2%: Utah added about 21,800 jobs while Alaska added approximately 3,900.
- Only four states recorded statistically significant year-over-year payroll gains: Nevada, Minnesota, North Carolina, and Texas. Many other states showed positive numerical growth, but BLS did not consider the change statistically significant.
- Fast job growth does not automatically mean low unemployment: Nevada led the country in payroll growth while its June unemployment rate was 5.1%, compared with the 4.2% national rate.
- Several states lost payroll jobs: Virginia, Montana, Oregon, Maryland, Iowa and several other states had fewer nonfarm payroll jobs than one year earlier.
How We Ranked States by Job Market Growth
This ranking uses total nonfarm payroll employment from the Bureau of Labor Statistics Current Employment Statistics program. The primary measure is the percentage change in seasonally adjusted payroll employment from June 2025 to June 2026.
That gives us a straightforward answer to the question: How quickly is the number of jobs in each state’s economy growing or shrinking?
When two or more states have the same reported percentage change, we use the number of net jobs added as a tie-breaker. For example, Texas, North Carolina, Utah and Alaska each posted 1.2% growth. Texas ranks first within that group because it added approximately 177,900 jobs, compared with 62,900 in North Carolina, 21,800 in Utah and 3,900 in Alaska.
There is an important statistical limitation. State payroll estimates are survey-based and subject to sampling error and later revisions. BLS therefore distinguishes between a numerical increase and an increase large enough to be statistically significant. In June 2026, only Nevada, Minnesota, North Carolina and Texas had statistically significant year-over-year increases.
We still rank all 50 states because the numerical data are useful for comparison, but a 0.6% reading should not be interpreted as proof that one state’s labor market is definitively outperforming another state at 0.5%.
All 50 States Ranked by Job Market Growth in 2026
| Rank | State | 12-Month Job Growth | Net Jobs Added / Lost |
|---|---|---|---|
| 1 | Nevada | +2.3% | +36,700 |
| 2 | Minnesota | +1.5% | +45,900 |
| 3 | Texas | +1.2% | +177,900 |
| 4 | North Carolina | +1.2% | +62,900 |
| 5 | Utah | +1.2% | +21,800 |
| 6 | Alaska | +1.2% | +3,900 |
| 7 | Colorado | +1.0% | +28,600 |
| 8 | Louisiana | +1.0% | +19,300 |
| 9 | Wyoming | +1.0% | +2,900 |
| 10 | Alabama | +0.9% | +20,400 |
| 11 | Tennessee | +0.8% | +25,300 |
| 12 | South Carolina | +0.8% | +18,300 |
| 13 | Kansas | +0.8% | +12,100 |
| 14 | Idaho | +0.8% | +7,400 |
| 15 | Arizona | +0.7% | +23,600 |
| 16 | California | +0.6% | +106,900 |
| 17 | Pennsylvania | +0.6% | +34,500 |
| 18 | Missouri | +0.6% | +18,700 |
| 19 | New Mexico | +0.6% | +5,800 |
| 20 | Massachusetts | +0.5% | +18,000 |
| 21 | Connecticut | +0.5% | +9,300 |
| 22 | Hawaii | +0.5% | +3,300 |
| 23 | South Dakota | +0.5% | +2,300 |
| 24 | New York | +0.4% | +43,900 |
| 25 | Ohio | +0.4% | +22,200 |
| 26 | Mississippi | +0.4% | +4,800 |
| 27 | Arkansas | +0.4% | +4,700 |
| 28 | Florida | +0.3% | +30,700 |
| 29 | New Hampshire | +0.3% | +2,300 |
| 30 | West Virginia | +0.3% | +1,900 |
| 31 | Delaware | +0.3% | +1,600 |
| 32 | New Jersey | +0.2% | +8,000 |
| 33 | Oklahoma | +0.2% | +3,300 |
| 34 | Illinois | +0.1% | +9,200 |
| 35 | Georgia | +0.1% | +6,000 |
| 36 | Wisconsin | +0.1% | +2,000 |
| 37 | Washington | 0.0% | +900 |
| 38 | Michigan | 0.0% | +500 |
| 39 | Maine | -0.1% | -700 |
| 40 | Nebraska | -0.1% | -1,200 |
| 41 | Indiana | -0.1% | -4,000 |
| 42 | Vermont | -0.2% | -500 |
| 43 | North Dakota | -0.2% | -800 |
| 44 | Kentucky | -0.3% | -6,600 |
| 45 | Rhode Island | -0.4% | -1,900 |
| 46 | Iowa | -0.6% | -9,500 |
| 47 | Maryland | -0.7% | -18,700 |
| 48 | Oregon | -0.9% | -18,500 |
| 49 | Montana | -1.0% | -5,400 |
| 50 | Virginia | -1.0% | -43,600 |
Source: U.S. Bureau of Labor Statistics, seasonally adjusted nonfarm payroll employment, June 2025 to June 2026. Percentages are rounded to one decimal place. States with equal percentage growth are ordered by net jobs added. Preliminary figures may be revised.
Top 10 States for Job Growth in 2026
1. Nevada: 2.3% Job Growth
Nevada has the fastest percentage increase in payroll employment in the latest state data. Employment grew from approximately 1.577 million jobs in June 2025 to 1.614 million in June 2026, an increase of about 36,700 jobs.
The important qualification is unemployment. Nevada’s June unemployment rate was 5.1%, substantially higher than the 4.2% U.S. rate. A state can therefore be adding jobs quickly while still having a relatively large number of people actively looking for work.
For someone considering Nevada, the 2.3% growth figure is encouraging, but the next step should be examining openings in the specific occupation and metro area rather than assuming every worker is entering an unusually tight labor market.
2. Minnesota: 1.5% Job Growth
Minnesota added approximately 45,900 payroll jobs over the year, taking statewide employment from about 3.023 million to 3.069 million.
That is particularly notable because Minnesota added more jobs than Nevada in absolute terms even though Nevada grew more quickly as a percentage of its smaller employment base.
Minnesota’s June unemployment rate was 4.4%. BLS considered its 1.5% payroll increase statistically significant, putting Minnesota alongside Nevada, Texas and North Carolina as the clearest state-level employment gainers in the latest release.
3. Texas: 1.2% Job Growth
Texas is the most important state in the ranking if you care about the number of jobs being created rather than only the growth percentage.
Texas added approximately 177,900 nonfarm payroll jobs between June 2025 and June 2026. No other state came close. California was second in numerical job creation with about 106,900 additional jobs.
Texas’ 1.2% growth rate ties North Carolina, Utah and Alaska, but the size of its labor market gives a job seeker an enormous number of potential employers spread across Dallas-Fort Worth, Houston, Austin, San Antonio and numerous secondary markets.
The statewide unemployment rate was 4.4% in June, slightly above the national rate. That is a useful reminder that rapid job creation and unemployment can rise at the same time when the labor force is also expanding.
4. North Carolina: 1.2% Job Growth
North Carolina added approximately 62,900 jobs over the year, bringing total nonfarm payroll employment to about 5.115 million.
The combination of 1.2% payroll growth and a 3.6% unemployment rate makes North Carolina particularly interesting for someone comparing states for a possible career move. Its employment growth was one of only four year-over-year gains that BLS identified as statistically significant.
The statewide figure still hides substantial local differences. Charlotte, Raleigh-Durham, the Triad, Asheville and smaller manufacturing markets have different industry mixes, salaries and housing costs, so a worker should ultimately compare the specific metro where the job opportunity exists.
5. Utah: 1.2% Job Growth
Utah added approximately 21,800 payroll jobs over the year and had a June unemployment rate of 3.6%.
Its percentage increase equals Texas, North Carolina and Alaska, but Utah ranks behind Texas and North Carolina because its smaller labor market produced fewer net jobs. That does not make the growth less meaningful locally. It simply demonstrates why percentages and raw job counts should be read together.
6. Alaska: 1.2% Job Growth
Alaska also posted 1.2% year-over-year payroll growth, representing approximately 3,900 additional jobs.
The percentage looks identical to Texas, but Texas added about 174,000 more jobs. For job seekers, Alaska therefore illustrates the limitation of ranking states by growth rate alone. A rapidly growing small employment base can produce a high percentage without creating the sheer number of openings available in a much larger state.
7. Colorado: 1.0% Job Growth
Colorado added approximately 28,600 payroll jobs over the year, bringing statewide employment to roughly 2.97 million. Its June unemployment rate was 3.9%, slightly below the national rate.
The 1.0% increase places Colorado comfortably within the top ten, although BLS did not identify the year-over-year change as statistically significant in its June release.
8. Louisiana: 1.0% Job Growth
Louisiana also posted a 1.0% numerical increase, adding approximately 19,300 jobs over the year.
Its June unemployment rate was 4.4%. Louisiana ranks behind Colorado because both had the same rounded growth percentage while Colorado added more jobs.
9. Wyoming: 1.0% Job Growth
Wyoming’s employment increased by approximately 2,900 positions, enough to produce a 1.0% increase because the state’s entire payroll employment base is under 300,000 jobs.
The state’s 3.2% unemployment rate was also well below the national rate. As with Alaska, however, workers should distinguish between a favorable percentage and the total number of positions available in their particular field.
10. Alabama: 0.9% Job Growth
Alabama rounds out the top ten with approximately 20,400 additional payroll jobs and a June unemployment rate of 3.2%.
Its combination of positive payroll growth and relatively low unemployment deserves more attention than the original article gave it. Alabama’s statewide labor market is smaller than Texas, Florida or California, but the latest data place it ahead of Tennessee, South Carolina, Idaho, Arizona and Florida on year-over-year percentage employment growth.
Fastest Job Growth vs. Most Jobs Added
A job-growth percentage tells you how fast a labor market is expanding relative to its existing size. The number of jobs added tells you how much the actual employment base increased.
Those are related measures, but they answer different questions.
| Rank by Jobs Added | State | Jobs Added | Growth Rate |
|---|---|---|---|
| 1 | Texas | +177,900 | +1.2% |
| 2 | California | +106,900 | +0.6% |
| 3 | North Carolina | +62,900 | +1.2% |
| 4 | Minnesota | +45,900 | +1.5% |
| 5 | New York | +43,900 | +0.4% |
| 6 | Nevada | +36,700 | +2.3% |
| 7 | Pennsylvania | +34,500 | +0.6% |
| 8 | Florida | +30,700 | +0.3% |
| 9 | Colorado | +28,600 | +1.0% |
| 10 | Tennessee | +25,300 | +0.8% |
Texas is the clearest example. It ranks third by our percentage-growth method but first by the number of jobs added. California ranks only 16th by growth rate but added the second-largest number of payroll jobs.
Florida provides another useful correction. Florida was frequently described as one of America’s fastest-growing job markets in earlier datasets. In the current June 2026 comparison, it added about 30,700 jobs but grew only 0.3%, placing it 28th by percentage growth.
Does a Low Unemployment Rate Mean a Better Job Market?
Not necessarily. Job growth and unemployment measure different things.
Payroll growth measures changes in the number of jobs reported by employers. The unemployment rate measures the share of the civilian labor force that does not have a job and is actively looking for one.
South Dakota had the lowest unemployment rate in June 2026 at 2.0%, followed by North Dakota at 2.3%. Hawaii and Vermont were at 2.6%, while Nebraska and New Hampshire were at 2.9%.
Yet none of those states led the payroll-growth ranking. South Dakota grew 0.5%, North Dakota’s employment declined 0.2%, Hawaii grew 0.5%, Vermont declined 0.2%, Nebraska declined 0.1%, and New Hampshire grew 0.3%.
Meanwhile, Nevada led the country in job growth at 2.3% but had unemployment of 5.1%.
That combination is not contradictory. A state can add jobs while its labor force is also growing, or while more people begin looking for work. Likewise, a state with very low unemployment can have slow job creation because most available workers are already employed and population growth is limited.
Only Four States Had Statistically Significant Job Growth
The most important qualification in the entire ranking is buried when websites simply sort BLS numbers and call every increase “growth.”
BLS reported that from June 2025 to June 2026, statistically significant payroll employment increases occurred in only four states:
- Nevada: +36,700 jobs, +2.3%
- Minnesota: +45,900 jobs, +1.5%
- North Carolina: +62,900 jobs, +1.2%
- Texas: +177,900 jobs, +1.2%
Virginia recorded a statistically significant decline of 43,600 jobs, or 1.0%.
The other state estimates still matter, but BLS determined that their changes were not large enough relative to the survey’s uncertainty to say with the same confidence that employment had genuinely increased or decreased.
If you are making a major decision such as changing jobs, selling a home or moving across the country, that distinction is more useful than pretending a state at +0.4% is clearly outperforming one at +0.3%.
Which States Lost Jobs in the Latest 2026 Data?
Several states had fewer payroll jobs in June 2026 than they had one year earlier.
Virginia recorded the largest numerical loss among states, declining by approximately 43,600 jobs. Maryland lost about 18,700, Oregon lost 18,500, Iowa lost 9,500, Kentucky lost 6,600, Montana lost 5,400, and Indiana lost about 4,000.
Percentage declines were largest in Virginia and Montana at 1.0%, followed by Oregon at 0.9% and Maryland at 0.7%.
Again, the statistical distinction matters. BLS identified Virginia’s year-over-year decline as statistically significant. The numerical decreases elsewhere should be monitored, but they do not necessarily mean those states have entered broad labor-market contractions.
Which Industries Are Adding Jobs in 2026?
State rankings show where employment is changing, but they do not tell you whether the new jobs match your career.
At the national level, the June 2026 BLS employment report showed continued strength in health care and social assistance and professional and business services. Health care and social assistance added about 46,600 jobs during June, while professional and business services added about 36,000. Construction added about 11,000.
Other sectors were much softer. Leisure and hospitality lost approximately 61,000 jobs during June, information employment declined by about 9,000, and retail trade decreased by roughly 7,500.
This is why a software developer, nurse, electrician, accountant and restaurant manager can have completely different experiences in the same “fast-growing” state. Before moving for work, compare the employment trend in your actual occupation and industry rather than relying entirely on total statewide payroll growth.
How to Use State Job Growth Data When Deciding Where to Move
Start With Your Industry, Not the State Ranking
If you work in health care, the availability of hospitals, medical systems and specialized employers matters more than whether the overall state grew 1.0% or 0.7%. The same principle applies to finance, manufacturing, logistics, energy, technology, education and skilled trades.
Then Look at the Metro Area
Statewide data can hide enormous differences between cities. Texas contains Austin, Houston, Dallas-Fort Worth, San Antonio, El Paso and numerous smaller employment markets. A statewide gain does not mean each city or industry is growing equally.
The same applies to North Carolina. Charlotte’s employment base is different from Raleigh-Durham, Greensboro-Winston-Salem and coastal North Carolina.
Compare Salary With Housing Costs
A higher-paying job does not automatically leave you with more money after housing, transportation, insurance, taxes and everyday expenses. Before moving, compare the actual salary offer with rent or home prices near the workplace rather than comparing statewide average incomes.
Look at the Number of Employers
A city with one rapidly expanding employer can look attractive when you already have an offer there. A region containing dozens of employers in your profession may provide better long-term career security because losing one job does not necessarily require another interstate move.
Do Not Move Based on One Month of Data
Employment statistics are revised, and economic conditions can change. A relocation decision should combine current job growth with an actual job offer, your occupation’s local demand, housing costs, family needs and the amount of financial cushion you will have after the move.
Moving to Another State for a Job
If a new job requires an interstate move, calculate the moving cost before assuming the higher salary automatically makes the transition worthwhile. A company may provide a relocation allowance, reimburse moving expenses after you start, pay a fixed signing bonus, or provide no moving assistance at all.
If reimbursement is involved, ask exactly what qualifies. Some employers reimburse professional moving services but not rental trucks, storage, temporary housing or packing. Others provide one fixed amount and leave the decision to you.
Coastal Moving Services is a licensed moving broker that coordinates interstate moves through a carrier network. If you already know your origin, destination and approximate inventory, you can compare the expected moving cost with any relocation package before accepting or finalizing the move.
Moving for a New Job?
Get a written estimate based on the actual route, household inventory, access conditions and services you need rather than trying to fit the move into a generic national average.
Use Our Moving Cost Calculator
Call Coastal Moving Services: 888-316-8329
FAQ About Job Growth by State
Which state has the fastest job growth in 2026?
Nevada ranks first in the latest available BLS state payroll data, with nonfarm employment increasing 2.3% from June 2025 to June 2026. Minnesota ranks second at 1.5%. Texas, North Carolina, Utah and Alaska each grew 1.2%.
Which state added the most jobs in 2026?
Texas added the most payroll jobs over the latest 12-month period, with approximately 177,900 additional nonfarm jobs from June 2025 to June 2026. California was second with roughly 106,900 jobs added, followed by North Carolina at approximately 62,900.
Is Florida still one of the fastest-growing job markets?
Not according to the latest year-over-year payroll data. Florida added approximately 30,700 jobs from June 2025 to June 2026, but because its employment base is very large, that represents growth of only about 0.3%. Florida ranks 28th in our percentage-growth table.
What states had statistically significant job growth?
BLS identified Nevada, Minnesota, North Carolina and Texas as the four states with statistically significant year-over-year payroll employment gains through June 2026.
Which states are losing jobs?
Virginia, Montana, Oregon, Maryland, Iowa, Rhode Island, Kentucky, Vermont, North Dakota, Indiana, Nebraska and Maine all had fewer payroll jobs than a year earlier in the June 2026 numerical estimates. Virginia’s decline of approximately 43,600 jobs was statistically significant.
Does low unemployment mean a state has strong job growth?
No. Unemployment and job growth measure different things. South Dakota had the lowest June 2026 unemployment rate at 2.0%, but payroll employment grew only 0.5%. Nevada had the fastest job growth at 2.3% while unemployment was 5.1%.
What is the best state to move to for jobs?
There is no single best state for every worker. Nevada currently has the highest percentage job growth, Texas added the most jobs, and North Carolina combines 1.2% job growth with relatively low 3.6% unemployment. Your occupation, salary, housing costs and the number of employers in your field are more important than the overall state ranking alone.
How often are state job growth rankings updated?
The Bureau of Labor Statistics publishes State Employment and Unemployment data monthly. Preliminary payroll figures can be revised in later releases and through annual benchmarking, so rankings can change during the year.