

That distinction matters. A broader livability ranking may give heavy weight to housing costs, taxes, jobs, or economic growth. This ranking intentionally focuses on what daily life is like once you are there: commute times, access to public transportation, trails and recreation, cultural amenities, weather, air quality, environmental conditions, and safety.
There is also no single universally accepted quality-of-life ranking. CNBC’s 2026 quality-of-life analysis names Vermont the national leader, followed by Maine, New Jersey, Minnesota, and Connecticut. WalletHub’s narrower Quality of Life category instead ranks New York first. The difference comes from methodology, which is why this guide shows the individual factors behind our ranking rather than presenting an unexplained list.
Key Points: Quality of Life by State in 2026
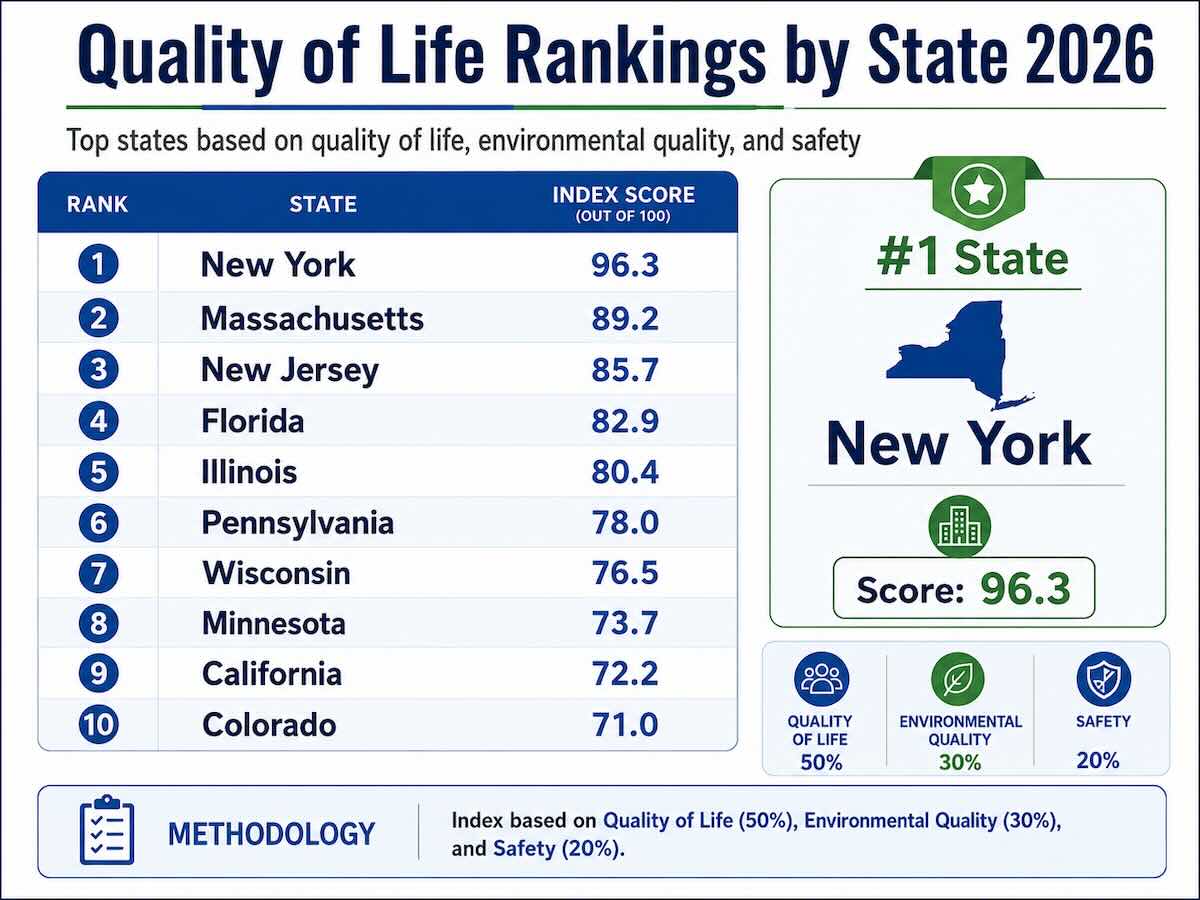
- #1 in our Quality of Life & Environment Index: New York, with a score of 96.3.
- Top five overall: New York, Massachusetts, New Jersey, Florida, and Illinois.
- WalletHub’s #1 Quality of Life state: New York.
- Best environmental quality: Hawaii, followed by Vermont, New York, New Hampshire, and South Dakota.
- CNBC’s #1 state for quality of life: Vermont, followed by Maine, New Jersey, Minnesota, and Connecticut.
- Best safety rank among the states in our top 10: New Jersey, which ranks #1 for safety in WalletHub’s 2026 study.
- What is deliberately excluded: affordability, job growth, taxes, and broader economic rankings. Those answer a different “best state to live” question.
All 50 States Ranked by Quality of Life and Environment
Our 2026 index combines three state-level rankings on the same 1-to-50 scale:
- 50% — Quality of Life: WalletHub’s 2026 Quality of Life category, which measures factors including work hours, commute times, trails, public transportation, road quality, congestion, restaurants, cultural venues, fitness facilities, beaches, weather, and air quality.
- 30% — Environmental Quality: WalletHub’s 2026 Environmental Quality category, based on air quality, water quality, soil quality, and energy efficiency.
- 20% — Safety: WalletHub’s 2026 Safety category, which incorporates violent crime, property crime, traffic fatalities, and law-enforcement staffing.
We convert the weighted rank into a 0-to-100 editorial index, where a higher score indicates a stronger combined result. This is a quality-of-life and environment index, not a general ranking of the best states to live in. Housing affordability, state taxes, job growth, and economic performance are not included.
| Rank | State | Index Score | Quality of Life | Environment | Safety |
|---|---|---|---|---|---|
| 1 | New York | 96.3 | 1 | 3 | 7 |
| 2 | Massachusetts | 89.2 | 6 | 7 | 6 |
| 3 | New Jersey | 85.7 | 9 | 11 | 1 |
| 4 | Florida | 82.9 | 3 | 19 | 11 |
| 5 | Illinois | 80.4 | 5 | 21 | 9 |
| 6 | Pennsylvania | 78.0 | 4 | 26 | 10 |
| 7 | Wisconsin | 76.5 | 14 | 13 | 8 |
| 8 | Minnesota | 73.7 | 12 | 9 | 26 |
| 9 | California | 72.2 | 2 | 20 | 38 |
| 10 | Colorado | 71.0 | 8 | 6 | 47 |
| 11 | Michigan | 67.3 | 13 | 15 | 30 |
| 12 | Iowa | 65.5 | 16 | 25 | 12 |
| 13 | Maine | 64.7 | 25 | 10 | 14 |
| 14 | Washington | 64.1 | 10 | 12 | 50 |
| 15 | Connecticut | 63.7 | 24 | 14 | 13 |
| 16 | Oregon | 61.4 | 11 | 16 | 48 |
| 17 | New Hampshire | 61.2 | 36 | 4 | 4 |
| 18 | Virginia | 58.8 | 23 | 17 | 23 |
| 19 | Ohio | 58.6 | 15 | 30 | 24 |
| 20 | Nebraska | 52.4 | 27 | 18 | 27 |
| 21 | Texas | 52.0 | 7 | 48 | 33 |
| 22 | South Dakota | 51.6 | 40 | 5 | 16 |
| 23 | Indiana | 51.2 | 22 | 33 | 20 |
| 24 | Georgia | 50.2 | 20 | 40 | 17 |
| 25 | Maryland | 49.2 | 33 | 8 | 35 |
| 26 | Wyoming | 48.8 | 37 | 24 | 2 |
| 27 | Kansas | 48.6 | 18 | 38 | 29 |
| 28 | North Carolina | 47.1 | 17 | 34 | 41 |
| 29 | Missouri | 45.7 | 26 | 22 | 40 |
| 30 | Utah | 45.1 | 29 | 32 | 19 |
| 31 | Vermont | 43.9 | 43 | 2 | 32 |
| 32 | Idaho | 42.2 | 31 | 44 | 3 |
| 33 | Hawaii | 41.4 | 42 | 1 | 42 |
| 34 | Montana | 41.0 | 30 | 27 | 34 |
| 35 | Nevada | 37.3 | 19 | 50 | 36 |
| 36 | North Dakota | 37.1 | 39 | 31 | 15 |
| 37 | Arizona | 35.5 | 21 | 45 | 43 |
| 38 | Tennessee | 34.1 | 35 | 28 | 37 |
| 39 | Rhode Island | 29.4 | 44 | 42 | 5 |
| 40 | Alabama | 27.8 | 41 | 39 | 21 |
| 41 | Delaware | 27.6 | 48 | 23 | 28 |
| 42 | South Carolina | 26.9 | 34 | 36 | 45 |
| 43 | Mississippi | 26.9 | 49 | 29 | 18 |
| 44 | Kentucky | 25.7 | 45 | 35 | 22 |
| 45 | New Mexico | 25.3 | 28 | 46 | 49 |
| 46 | Oklahoma | 24.7 | 32 | 47 | 39 |
| 47 | Louisiana | 20.6 | 38 | 49 | 31 |
| 48 | West Virginia | 19.8 | 46 | 41 | 25 |
| 49 | Arkansas | 9.8 | 47 | 43 | 44 |
| 50 | Alaska | 9.6 | 50 | 37 | 46 |
Method note: #1 is best for each underlying rank. The index is calculated from 50% Quality of Life rank, 30% Environmental Quality rank, and 20% Safety rank. The resulting weighted rank is normalized to a 0–100 scale. This is an editorial comparison created by Coastal Moving Services from published 2026 rankings; it is not a WalletHub composite score.
Which States Have the Best Quality of Life and Environment?
1. New York
New York takes the top position because it performs extremely well across the exact factors this page measures. WalletHub ranks New York #1 for Quality of Life, #3 for Environmental Quality, and #7 for Safety. Its Quality of Life result benefits from extensive public transportation, cultural amenities, restaurants, recreation, and other daily-living measures.
That does not mean New York is the best state for every household. Housing costs and taxes can materially change the decision, but those factors are intentionally outside this ranking.
2. Massachusetts
Massachusetts has one of the most balanced profiles in the country: #6 for Quality of Life, #7 for Environmental Quality, and #6 for Safety. It does not need a single first-place category to score well because all three components remain near the top.
Its healthcare performance also adds useful context. The Commonwealth Fund ranks Massachusetts first nationally for overall health-system performance in its latest State Scorecard.
3. New Jersey
New Jersey combines a #9 Quality of Life ranking with the #1 Safety ranking and #11 Environmental Quality position. CNBC independently ranks New Jersey third for quality of life in its 2026 assessment, reinforcing its position as one of the more consistent states across different methods.
4. Florida
Florida ranks #3 in WalletHub’s Quality of Life category. Its warm climate, beaches, restaurants, recreation, and other lifestyle measures help drive that result. The state ranks #19 for Environmental Quality and #11 for Safety, producing a strong combined score.
Florida also demonstrates why this article should stay separate from a general “best states to live” ranking. Housing costs, insurance costs, and economic considerations can change the practical decision even when the state’s lifestyle score is high.
5. Illinois
Illinois ranks #5 for Quality of Life and #9 for Safety. Its Environmental Quality rank of #21 is more moderate, but the state remains high overall because daily-living and safety measures carry 70% of our index.
6. Pennsylvania
Pennsylvania ranks fourth in WalletHub’s Quality of Life category and tenth for Safety. Its Environmental Quality result is lower at #26, which keeps it just outside the top five in our combined ranking.
7. Wisconsin
Wisconsin does not rely on one standout category. It ranks #14 for Quality of Life, #13 for Environmental Quality, and #8 for Safety. That consistency produces one of the strongest balanced results in the country.
8. Minnesota
Minnesota combines a #12 Quality of Life result with a strong #9 Environmental Quality ranking. CNBC places Minnesota fourth in its 2026 quality-of-life assessment, although its #26 WalletHub Safety position prevents it from ranking higher in our index.
9. California
California is second in WalletHub’s Quality of Life category, helped by recreation, culture, restaurants, beaches, fitness access, and weather. Environmental Quality ranks #20. Safety, at #38, is the biggest drag on its combined result.
10. Colorado
Colorado ranks #8 for Quality of Life and #6 for Environmental Quality, making it one of the strongest states for the combination of outdoor access and day-to-day living. Its #47 Safety rank in WalletHub’s methodology substantially reduces its overall index score.
Which State Has the Best Quality of Life According to CNBC?
CNBC ranks Vermont #1 for quality of life in 2026. Maine ranks second, New Jersey third, Minnesota fourth, and Connecticut fifth.
| Rank | State | CNBC Quality of Life |
|---|---|---|
| 1 | Vermont | 233 of 290 points |
| 2 | Maine | 232 of 290 points |
| 3 | New Jersey | 223 of 290 points |
| 4 | Minnesota | 210 of 290 points |
| 5 | Connecticut | 205 of 290 points |
CNBC uses a different definition of quality of life. Its framework considers crime, environmental quality, healthcare, childcare, worker protections, inclusiveness, and other factors important to attracting and retaining workers.
That is why Vermont can rank first with CNBC but much lower in WalletHub’s Quality of Life category. WalletHub gives significant weight to transit, congestion, restaurants, bars, museums, performing arts, fitness facilities, beaches, weather, trails, and other measures of daily amenities.
Neither methodology is inherently the “correct” one. They answer slightly different questions.
Which States Have the Best Environmental Quality?
For the environmental component of our index, we use WalletHub’s Environmental Quality subcategory rather than its broader “Greenest States” overall score. That keeps the focus on conditions residents experience directly: air, water, soil, and energy efficiency.
| Rank | State | Environmental Context |
|---|---|---|
| 1 | Hawaii | Top environmental-quality rank; also #1 for water quality. |
| 2 | Vermont | #2 environmental quality and #1 greenest state overall. |
| 3 | New York | Strong air, water, soil and efficiency combination. |
| 4 | New Hampshire | Also ranks third nationally for air quality. |
| 5 | South Dakota | Strong air and water quality results. |
| 6 | Colorado | Strong environmental-quality score and high green-building presence. |
| 7 | Massachusetts | Strong environmental quality and energy efficiency. |
| 8 | Maryland | Ranks first for LEED-certified buildings per capita. |
| 9 | Minnesota | Strong environmental quality and soil-quality measures. |
| 10 | Maine | Strong air quality and low-impact environmental profile. |

Why Do State Quality of Life Rankings Disagree?
The phrase “quality of life” does not have one standardized national definition. A ranking can change dramatically depending on what the publisher considers part of a good daily life.
WalletHub emphasizes daily amenities and convenience
Its Quality of Life category includes work hours, commute time, trails, bicycle friendliness, public transportation, road quality, traffic congestion, restaurants, bars, museums, performing arts, movie theaters, fitness centers, beach access, weather, and air quality.
That framework helps explain why New York, California, Florida, Pennsylvania, and Illinois perform so well. Large states with major metropolitan areas have unusually deep cultural, transportation, dining, recreation, and entertainment networks.
CNBC places more weight on worker and family conditions
CNBC evaluates quality of life as part of its annual America’s Top States for Business study. Its framework considers crime, healthcare, environmental quality, childcare, worker protections, inclusiveness, and other conditions that can affect whether workers want to live in a state.
That methodology strongly favors Vermont, Maine, New Jersey, Minnesota, and Connecticut in 2026.
Environmental rankings answer another question
A state can provide excellent parks, restaurants, transit, and cultural amenities while still dealing with pollution or environmental pressures. Conversely, a state with exceptional air and water quality may offer fewer urban amenities or weaker transportation access.
That is why this page exposes all three components instead of hiding them inside one unexplained score.
What Actually Improves Quality of Life?
State rankings are useful for comparison, but residents experience quality of life locally. A high-ranking state can contain both exceptionally comfortable communities and places where long commutes, pollution, poor healthcare access, or crime create a very different experience.
Shorter commutes and useful transportation
Time spent commuting directly affects the amount of time available for family, recreation, sleep, and daily routines. Public transportation can also determine whether a household needs one car, two cars, or no car at all.
Access to recreation
Trails, parks, beaches, fitness facilities, walkable areas, and outdoor recreation make it easier to build physical activity into normal life. They also expand the number of things residents can do without planning expensive trips.
Clean air and water
Environmental quality is more than scenery. Air pollution, water quality, and other environmental conditions can affect respiratory health, outdoor activity, and how comfortable it is to spend time outside.
Safety
Crime and traffic safety change how residents use their communities. They influence whether people feel comfortable walking at night, allowing children more independence, using public spaces, or commuting by bike or on foot.
Healthcare access
Healthcare is not part of our numerical index because we have a separate state healthcare ranking, but it still matters when comparing destinations. The Commonwealth Fund’s latest State Scorecard places Massachusetts, Hawaii, New Hampshire, and Rhode Island among the strongest health systems in the country.
For a deeper comparison, see our States Ranked by Healthcare in 2026 study.
Does a High Quality of Life Mean a State Is Affordable?
No. This ranking deliberately separates quality of life from affordability.
New York, Massachusetts, New Jersey, California, and other high-scoring states can be expensive places to live. Their quality-of-life advantages come from factors such as transportation, healthcare infrastructure, cultural access, recreation, environmental quality, and safety rather than low housing costs.
The reverse is also true. A state can offer inexpensive housing while scoring lower for transportation, environmental quality, recreation, healthcare access, or other day-to-day factors.
This distinction is important because otherwise a quality-of-life article simply becomes another version of a general “best states to live” ranking. Readers should decide separately how much they are willing to pay for the lifestyle and services a state provides.
How Should You Use Quality of Life Rankings When Choosing a State?
Start with the statewide ranking as a filter, then move quickly to specific cities and communities.
- Choose three to five states that perform well on the factors you care about most.
- Check individual cities for crime, hospital access, commute times, parks, trails, and air quality.
- Compare actual housing costs in the neighborhoods you would realistically consider.
- Check environmental conditions locally. State averages can hide substantial differences between counties and metropolitan areas.
- Visit before deciding and test the ordinary routines that rankings cannot measure: grocery access, traffic, walking, parks, noise, and travel time to essential services.
A state can rank highly while the particular community you are considering does not. Local conditions should always have the final say.
Planning a Move After Comparing States?
If your research has narrowed the list to one or two destinations, the next useful number is the cost of the move itself. Distance, shipment size, packing, access conditions, and the season can all change an interstate moving estimate.
Use our moving cost calculator to create a planning range, or review our long-distance moving guide to understand interstate estimates, delivery windows, and the moving process.
Coastal Moving Services is a moving broker that arranges interstate household-goods transportation with authorized motor carriers. The assigned carrier performs the physical transportation.
Frequently Asked Questions
Which state has the best quality of life in 2026?
It depends on the methodology. New York ranks first in our 2026 Quality of Life & Environment Index because it is #1 in WalletHub’s Quality of Life category, #3 for Environmental Quality, and #7 for Safety. CNBC’s separate 2026 quality-of-life ranking places Vermont first.
What are the best states for quality of life?
Our top 10 are New York, Massachusetts, New Jersey, Florida, Illinois, Pennsylvania, Wisconsin, Minnesota, California, and Colorado. The ranking combines quality of life, environmental quality, and safety rather than affordability or economic performance.
Which state has the best environment?
Hawaii ranks first for Environmental Quality in WalletHub’s 2026 environmental study, followed by Vermont, New York, New Hampshire, and South Dakota. The category measures air quality, water quality, soil quality, and energy efficiency.
Why does CNBC rank Vermont first while this ranking places New York first?
The methodologies are different. CNBC places more emphasis on crime, healthcare, childcare, environmental quality, worker protections, and inclusiveness. WalletHub’s Quality of Life category gives more weight to commute times, transit, trails, restaurants, cultural venues, fitness facilities, beaches, weather, and air quality. Our index combines WalletHub’s quality-of-life result with separate environment and safety rankings.
Which states are safest among the quality-of-life leaders?
New Jersey ranks first for Safety in WalletHub’s 2026 study. New Hampshire ranks fourth, Rhode Island fifth, Massachusetts sixth, New York seventh, Wisconsin eighth, Illinois ninth, and Pennsylvania tenth.
Is quality of life the same as the best state to live in?
No. A best-state-to-live ranking generally combines quality of life with affordability, jobs, taxes, education, healthcare, and broader economic conditions. This article focuses specifically on quality of life, environmental quality, and safety so those concepts do not get mixed together.
Does affordability affect this ranking?
No. Affordability is deliberately excluded from the index. A state can rank very well for daily living, recreation, transportation, safety, and environmental conditions while remaining expensive. Housing and cost of living should be compared separately.
Why is Hawaii only 33rd in the combined ranking if it has the best environment?
Hawaii ranks first for Environmental Quality, but WalletHub places it 42nd for both Quality of Life and Safety in the specific datasets used for this index. Because environmental quality accounts for 30% of our score rather than the entire score, Hawaii’s exceptional environmental result does not fully offset the other two factors.
Why does California rank highly despite its environmental challenges?
California ranks second in WalletHub’s Quality of Life category because of its recreation, cultural amenities, restaurants, fitness access, beaches, weather, and other daily-living factors. Its Environmental Quality rank is 20th and Safety rank is 38th, which pulls it down to ninth in our combined index.
Should I choose a state based on this ranking?
Use the ranking to create a shortlist. Then compare the actual cities and neighborhoods you might live in. Housing costs, local crime, nearby hospitals, commute times, air quality, schools, parks, and access to daily services can vary substantially within the same state.
Methodology
The Coastal Moving Services 2026 Quality of Life & Environment Index uses three published state rankings:
- Quality of Life — 50%: WalletHub, Best States to Live In 2026, Quality of Life subcategory.
- Environmental Quality — 30%: WalletHub, Greenest States 2026, Environmental Quality subcategory.
- Safety — 20%: WalletHub, Best States to Live In 2026, Safety subcategory.
Each source ranks all 50 states from 1 to 50, with #1 representing the strongest result. We calculate a weighted average rank using the percentages above and convert it to a 0-to-100 index for easier comparison.
We use the Environmental Quality subcategory rather than WalletHub’s overall Greenest States score because this article is concerned with the environment residents experience. Environmental Quality specifically measures air, water, soil, and energy efficiency. The wider Greenest States ranking also evaluates household behavior and state climate contributions, which answer a somewhat different question.
CNBC’s 2026 Quality of Life ranking is shown separately because its methodology differs substantially and its public reporting does not provide the same complete three-factor dataset used in our all-50-state calculation.
Important: This index does not include affordability, taxation, economic growth, housing prices, or job-market strength. Those belong in broader livability research rather than a focused quality-of-life and environment ranking.
References
- WalletHub — Best States to Live In, updated August 10, 2026
- WalletHub — Greenest States, April 8, 2026
- The Commonwealth Fund — 2025 Scorecard on State Health System Performance
- Connecticut Business & Industry Association — 2026 CNBC Top States ranking and quality-of-life results
Last reviewed: August 15, 2026
State rankings summarize broad conditions and cannot capture every local difference. Always check the specific city, county, healthcare network, neighborhood, environmental conditions, and housing market you are considering before making a moving decision.