


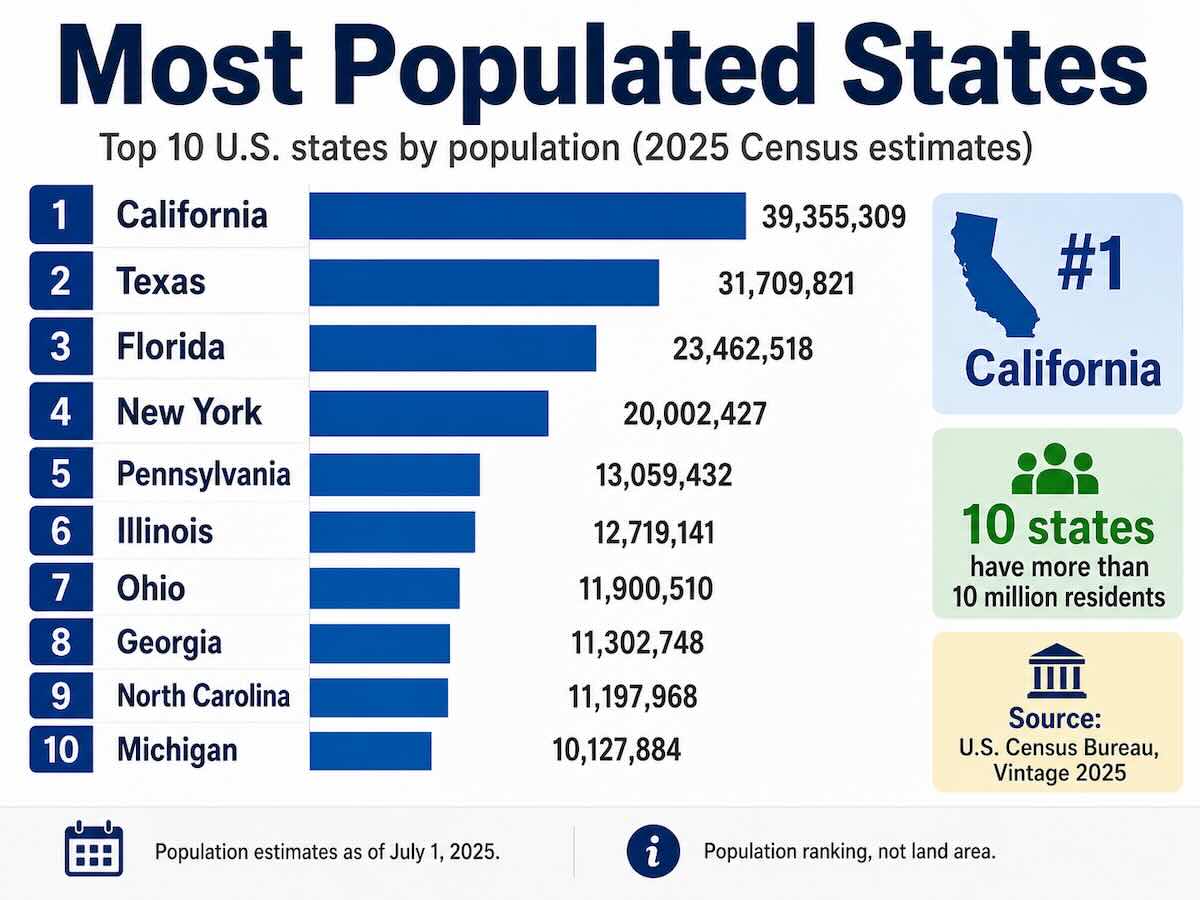
Largest states by population is California with 39,355,309 residents as of July 1, 2025. Texas ranks second with 31,709,821 people, followed by Florida with 23,462,518. At the other end of the list, Wyoming is the least populous state with 588,753 residents.
This ranking covers all 50 states using the U.S. Census Bureau’s Vintage 2025 Population Estimates, the newest completed and internally consistent state population series available in 2026. The table also shows each state’s revised 2024 population so you can see where population increased or decreased during the latest year.
In total, the Census Bureau estimated the U.S. population at 341,784,857 on July 1, 2025. The 10 most populated states contain about 54.1% of the country’s residents, showing how heavily the U.S. population is concentrated in a relatively small group of states.
Key Population Facts
- Most populated state: California, with 39,355,309 residents.
- Second most populated state: Texas, with 31,709,821 residents.
- Least populated state: Wyoming, with 588,753 residents.
- States above 10 million people: 10 states.
- States below 1 million people: 5 states.
- Largest population gain from 2024 to 2025: Texas, up 391,243 residents.
- Fastest percentage growth: South Carolina, up 1.5% from 2024 to 2025.
- Most populated U.S. region: The South, with 133,833,983 residents.
All 50 U.S. States Ranked by Population
The table below ranks every U.S. state from most populated to least populated using Census Bureau estimates for July 1, 2025. The 2024 figures come from the same Vintage 2025 series, which matters because the Census Bureau revises earlier estimates whenever it releases a new vintage.
The phrase “largest state” can also refer to geographic size. This ranking is based only on population. Alaska is the largest state by land area, while California is the largest state by population.
U.S. States by Population: 2025 Ranking
| Rank | State | 2025 Population | 2024 Population | Annual Change |
|---|---|---|---|---|
| 1 | California | 39,355,309 | 39,364,774 | -9,465 |
| 2 | Texas | 31,709,821 | 31,318,578 | +391,243 |
| 3 | Florida | 23,462,518 | 23,265,838 | +196,680 |
| 4 | New York | 20,002,427 | 20,001,419 | +1,008 |
| 5 | Pennsylvania | 13,059,432 | 13,045,848 | +13,584 |
| 6 | Illinois | 12,719,141 | 12,703,033 | +16,108 |
| 7 | Ohio | 11,900,510 | 11,860,621 | +39,889 |
| 8 | Georgia | 11,302,748 | 11,204,208 | +98,540 |
| 9 | North Carolina | 11,197,968 | 11,052,061 | +145,907 |
| 10 | Michigan | 10,127,884 | 10,099,962 | +27,922 |
| 11 | New Jersey | 9,548,215 | 9,506,354 | +41,861 |
| 12 | Virginia | 8,880,107 | 8,819,642 | +60,465 |
| 13 | Washington | 8,001,020 | 7,927,958 | +73,062 |
| 14 | Arizona | 7,623,818 | 7,556,424 | +67,394 |
| 15 | Tennessee | 7,315,076 | 7,251,291 | +63,785 |
| 16 | Massachusetts | 7,154,084 | 7,138,560 | +15,524 |
| 17 | Indiana | 6,973,333 | 6,934,754 | +38,579 |
| 18 | Missouri | 6,270,541 | 6,243,544 | +26,997 |
| 19 | Maryland | 6,265,347 | 6,245,314 | +20,033 |
| 20 | Colorado | 6,012,561 | 5,988,502 | +24,059 |
| 21 | Wisconsin | 5,972,787 | 5,957,168 | +15,619 |
| 22 | Minnesota | 5,830,405 | 5,797,405 | +33,000 |
| 23 | South Carolina | 5,570,274 | 5,490,316 | +79,958 |
| 24 | Alabama | 5,193,088 | 5,163,055 | +30,033 |
| 25 | Louisiana | 4,618,189 | 4,614,878 | +3,311 |
| 26 | Kentucky | 4,606,864 | 4,584,046 | +22,818 |
| 27 | Oregon | 4,273,586 | 4,265,324 | +8,262 |
| 28 | Oklahoma | 4,123,288 | 4,097,758 | +25,530 |
| 29 | Connecticut | 3,688,496 | 3,674,449 | +14,047 |
| 30 | Utah | 3,538,904 | 3,502,983 | +35,921 |
| 31 | Nevada | 3,282,188 | 3,253,543 | +28,645 |
| 32 | Iowa | 3,238,387 | 3,230,454 | +7,933 |
| 33 | Arkansas | 3,114,791 | 3,096,080 | +18,711 |
| 34 | Kansas | 2,977,220 | 2,965,252 | +11,968 |
| 35 | Mississippi | 2,954,160 | 2,950,172 | +3,988 |
| 36 | New Mexico | 2,125,498 | 2,126,774 | -1,276 |
| 37 | Idaho | 2,029,733 | 2,000,872 | +28,861 |
| 38 | Nebraska | 2,018,006 | 2,005,591 | +12,415 |
| 39 | West Virginia | 1,766,147 | 1,767,402 | -1,255 |
| 40 | Hawaii | 1,432,820 | 1,434,952 | -2,132 |
| 41 | New Hampshire | 1,415,342 | 1,408,518 | +6,824 |
| 42 | Maine | 1,414,874 | 1,408,438 | +6,436 |
| 43 | Montana | 1,144,694 | 1,137,557 | +7,137 |
| 44 | Rhode Island | 1,114,521 | 1,110,415 | +4,106 |
| 45 | Delaware | 1,059,952 | 1,050,123 | +9,829 |
| 46 | South Dakota | 935,094 | 927,110 | +7,984 |
| 47 | North Dakota | 799,358 | 793,387 | +5,971 |
| 48 | Alaska | 737,270 | 736,537 | +733 |
| 49 | Vermont | 644,663 | 646,521 | -1,858 |
| 50 | Wyoming | 588,753 | 586,722 | +2,031 |
Source: U.S. Census Bureau, Vintage 2025 Population Estimates. Population figures represent estimates for July 1 of each year. Annual change is calculated from the revised 2024 and 2025 estimates within the same Census vintage.
Washington, D.C. is not included in the 50-state ranking. The District of Columbia had an estimated population of 693,645 in 2025. If it were inserted into the table purely by population, it would fall between Alaska and Vermont.
What Are the 10 Most Populated States?
The 10 most populated states are California, Texas, Florida, New York, Pennsylvania, Illinois, Ohio, Georgia, North Carolina, and Michigan. Together, they contain 184,837,758 people, or about 54.1% of the total U.S. population.
California remains comfortably in first place, but the gap between California and Texas has narrowed. California had 39.36 million residents in 2025 compared with Texas at 31.71 million, leaving a difference of about 7.65 million people.
The rankings also show the continued rise of the South. Georgia and North Carolina now both exceed 11 million residents, while North Carolina added more residents during the latest year than every state except Texas and Florida.
Population is only one way to compare states. If you are considering where your income will stretch further, our states ranked by cost of living guide compares the financial side of living in different parts of the country.
Which States Added the Most People From 2024 to 2025?
Texas recorded the largest numeric population increase in the country, adding 391,243 residents between July 1, 2024 and July 1, 2025. Florida came second with an increase of 196,680, followed by North Carolina with 145,907.
Largest State Population Gains, 2024 to 2025
| Rank | State | Population Added | 2025 Population |
|---|---|---|---|
| 1 | Texas | +391,243 | 31,709,821 |
| 2 | Florida | +196,680 | 23,462,518 |
| 3 | North Carolina | +145,907 | 11,197,968 |
| 4 | Georgia | +98,540 | 11,302,748 |
| 5 | South Carolina | +79,958 | 5,570,274 |
Numeric growth and percentage growth answer different questions. Texas gained the most people, but South Carolina had the fastest percentage growth at 1.5%. Idaho followed at 1.4%, North Carolina at 1.3%, Texas at 1.2%, and Utah at 1.0%.
Only five states lost population during the latest Census estimate period: California, Hawaii, New Mexico, Vermont, and West Virginia. California’s decline was 9,465 people, which was small compared with its population of more than 39 million. New York, which was often described as a shrinking state in earlier population reports, recorded a small increase of 1,008 residents in the current Vintage 2025 series.
Population growth does not automatically mean that a state is inexpensive. Readers comparing growing states can also review our state housing affordability rankings before comparing individual cities.
Which State Has the Smallest Population?
Wyoming is the least populated state in the United States, with 588,753 residents. Vermont ranks 49th with 644,663, followed by Alaska with 737,270, North Dakota with 799,358, and South Dakota with 935,094.
Those are the only five states with fewer than one million residents in the current Census estimates. Delaware, which ranks 45th, has moved above the one-million mark with an estimated population of 1,059,952.
Alaska provides a useful reminder that physical size and population size are very different measurements. It has the largest land area of any state but ranks only 48th by population.
Which U.S. Region Has the Largest Population?
The South is the most populated Census region, with 133,833,983 residents in 2025. That is approximately 39.2% of the country’s total population. The West ranks second, followed by the Midwest and Northeast.
| Region | 2025 Population | Share of U.S. Population |
|---|---|---|
| South | 133,833,983 | 39.2% |
| West | 80,146,154 | 23.4% |
| Midwest | 69,762,666 | 20.4% |
| Northeast | 58,042,054 | 17.0% |
The regional numbers also show why the current population story is more complicated than a simple Sun Belt versus Rust Belt split. All four Census regions gained population from 2024 to 2025, and every Midwest state increased its population during the latest estimate period.
Why Do State Population Rankings Matter?
State population figures are used far beyond population rankings. They help governments plan services, provide denominators for statistical rates, support business planning, and influence the distribution of federal funding. Population totals also help researchers understand where housing demand, employment, infrastructure needs, and consumer markets are expanding.
For someone deciding where to live, population is best used alongside more practical measures. A populous state may offer a large labor market and a wider choice of cities, but housing costs, taxes, schools, safety, and local job conditions can vary dramatically within the same state. Families comparing several destinations can also review our guide to the best states to raise a family.
Comparing States for a Move?
Population rankings can show where people live and where states are growing, but they do not tell you what an interstate move will cost. Use our moving cost calculator to build a more practical estimate based on your origin, destination, shipment size, and move details.
Coastal Moving Services is a moving broker that arranges interstate household-goods transportation with authorized motor carriers. The assigned carrier performs the physical transportation.
Frequently Asked Questions
What is the largest state by population in the United States?
California is the most populated U.S. state, with an estimated 39,355,309 residents as of July 1, 2025. Texas is second with 31,709,821 residents.
What are the top 5 most populated states?
The five most populated states are California with 39,355,309 residents, Texas with 31,709,821, Florida with 23,462,518, New York with 20,002,427, and Pennsylvania with 13,059,432. Together, those five states contain about 37.3% of the U.S. population.
How many U.S. states have more than 10 million people?
Ten states have populations above 10 million: California, Texas, Florida, New York, Pennsylvania, Illinois, Ohio, Georgia, North Carolina, and Michigan. New Jersey ranks 11th with 9,548,215 residents.
What is the least populated state?
Wyoming is the least populated U.S. state with 588,753 residents. Vermont is the second least populated with 644,663, followed by Alaska with 737,270.
How many states have fewer than 1 million people?
Five states have fewer than one million residents in the Vintage 2025 estimates: Wyoming, Vermont, Alaska, North Dakota, and South Dakota.
Is Texas going to overtake California in population?
Texas is closing the population gap, but the current Census estimates do not establish a specific year when Texas will overtake California. Texas had 31,709,821 residents in 2025 compared with California’s 39,355,309, leaving a gap of about 7.65 million. Texas added 391,243 residents from 2024 to 2025 while California declined by 9,465. Population growth rates can change considerably over time, so extending one year’s change into a long-term takeover date would be unreliable.
Is Alaska the largest state or is California the largest state?
Both descriptions can be correct depending on what is being measured. Alaska is the largest U.S. state by land area. California is the largest state by population.
What year are these state population rankings from?
The ranking uses U.S. Census Bureau Vintage 2025 Population Estimates for July 1, 2025. They are the latest completed and internally consistent Census state population estimates available when this article was reviewed in August 2026.
Methodology
This ranking uses the U.S. Census Bureau’s Vintage 2025 Population Estimates. The population column represents the estimated resident population of each state on July 1, 2025. The comparison column uses the revised July 1, 2024 estimate from the same Vintage 2025 series.
Using both years from one vintage is important because the Census Bureau revises the entire estimates series when a new vintage is released. Earlier published 2024 or 2025 figures from a previous vintage should therefore not be mixed with the current series when calculating annual change.
The Census Population Estimates Program begins with a population base and updates it using births, deaths, domestic migration, and international migration. The figures are estimates rather than a new census count. The next decennial census remains the 2030 Census.
Only the 50 states are ranked in the main table. Washington, D.C. is reported separately because it is not a state. Puerto Rico and other U.S. territories are also excluded from the 50-state ranking.
References
- U.S. Census Bureau: State Population Totals and Components of Change, 2020-2025
- U.S. Census Bureau: U.S. Population Growth Slows Due to Historic Decline in Net International Migration
- U.S. Census Bureau: Methodology for the United States Population Estimates, Vintage 2025
- U.S. Census Bureau: State Area Measurements and Internal Point Coordinates
Last reviewed: August 15, 2026