The gap between the most expensive cities in the US is larger in 2026 than at any previous point in measured history. Coupons.com’s January 2026 cost of living analysis found a cost-of-living index spread between the most expensive and most affordable U.S. cities of 158 index points, the difference between Paradise Valley, Arizona at an index of 223 and Helena-West Helena, Arkansas at 65. For major metropolitan areas, the comparable spread runs from San Francisco’s index of 195.7 to Midwest cities well below the national baseline of 100. For households considering a relocation, a promotion, or a remote work arrangement, the city column on a household budget spreadsheet is the single highest-leverage variable available: the same $175,000 income supports a materially different life in each of the ten cities below, and understanding exactly what each city costs, across housing, groceries, utilities, transportation, and taxes, is the foundation of any honest financial comparison.
How This Ranking Is Structured
This ranking uses a composite cost-of-living index (COLI) where 100 represents the U.S. national average. A score of 150 means a city is 50 percent more expensive than the national average overall. Cities are ranked by overall COLI, with supplemental data on median home price, average one-bedroom rent, and the specific expense categories that drive each city’s premium above the national baseline. All figures reflect 2026 data from multiple sources including Apartments.com, ExtraSpace Storage, LivingCostIndex, Numbeo, and Payscale unless otherwise noted.
A methodological note worth making at the outset: cost-of-living indices measure what things cost, not what residents earn. Several of the cities on this list carry median household incomes significantly above the national median, meaning that residents of high-cost cities are not necessarily financially stressed by those costs in direct proportion to the index. San Jose’s median income of approximately $103,000 against a COLI of 144.6 produces a different quality-of-life outcome than Miami’s COLI of 127.4 against a median income of $65,000. Where income context changes the financial picture meaningfully, it is noted in each city’s profile. The more relevant figure for households considering relocation is the income required to maintain a comparable lifestyle, not the income of current residents, and that figure is addressed for each city in the sections that follow.
Key Points (2026)
- San Francisco is the most expensive major U.S. city by overall cost-of-living index at 195.7, meaning it is 95.7 percent more expensive than the national average. The average one-bedroom apartment rents for $3,500 to $4,500 per month depending on neighborhood, the median home price exceeds $1.4 million, and the average single person’s monthly expenses including rent reach $5,915. Utilities run 49.4 percent above the national average, and groceries run 15.5 percent higher.
- New York City is the second most expensive major city at a COLI of 187.2, with an average one-bedroom rent of $4,082 per month in NYC overall (Manhattan averages $4,890) as of March 2026 per Apartments.com, and ExtraSpace’s 2026 data showing an average apartment rent of $5,703 in the premium Manhattan-focused segment. NYC ranked first in WalletHub’s January 2026 study of U.S. cities where cost-of-living anxiety is highest, with over 26,100 related monthly searches.
- California dominates the top ten, with four cities in the top eight: San Francisco (#1), Los Angeles (#3), San Jose (#4), and San Diego (#8). California’s combined factors of high income taxes (up to 13.3 percent marginal rate), Proposition 13-constrained housing supply, and persistent in-migration demand in its coastal markets produce a structural premium that has widened rather than narrowed despite significant post-pandemic out-migration.
- Honolulu is the most expensive city for groceries and utilities relative to the national average among the top ten, with groceries running 31.6 percent above the national average and utilities 93.1 percent above per Apartments.com’s 2026 data, driven by the cost of shipping virtually all goods and energy inputs across the Pacific. Housing in Honolulu runs 199.1 percent above the national average; a figure second only to San Francisco among non-Manhattan U.S. markets.
- Miami’s entry into the top ten reflects a pandemic-era transformation that is not yet complete. Miami’s COLI of 127.4 would not have placed it in the national top ten in 2019; the city’s housing costs have increased more than 60 percent since 2020 in some submarkets, driven by a combination of out-of-state in-migration from high-income coastal households, corporate headquarters relocations, and a constrained coastal land supply that mirrors other top-10 markets in geography if not yet in total price.
- Cost of living is rising fastest in New York City, San Diego, and San Francisco per LiveNOW from FOX’s January 2026 analysis of WalletHub data. NYC’s cost-of-living anxiety leads the country by search volume. San Diego ranked second nationally, San Francisco third, and Los Angeles fourth. Public utility hikes are a primary driver in Seattle; education and housing costs in Boston; and rising energy costs in Chicago, which did not make the top ten overall but is experiencing the fastest cost trajectory among major Midwest markets.
- The income required to live comfortably in the top-10 cities varies dramatically. MIT’s Living Wage Calculator estimates the living wage for a single adult in San Francisco at $89,000 per year, in New York City at $83,000 per year, and in Los Angeles at $74,000 per year; figures that represent gross income requirements for basic adequacy rather than comfort, with comfortable middle-class living in these cities typically requiring household incomes of $150,000 to $250,000 depending on family size and housing situation.
The 10 Most Expensive U.S. Cities (2026)
These markets represent the highest cost-of-living (COLI) benchmarks in the country. For many households, the vs. National Average figure below serves as the primary catalyst for a 2026 Midwest relocation.
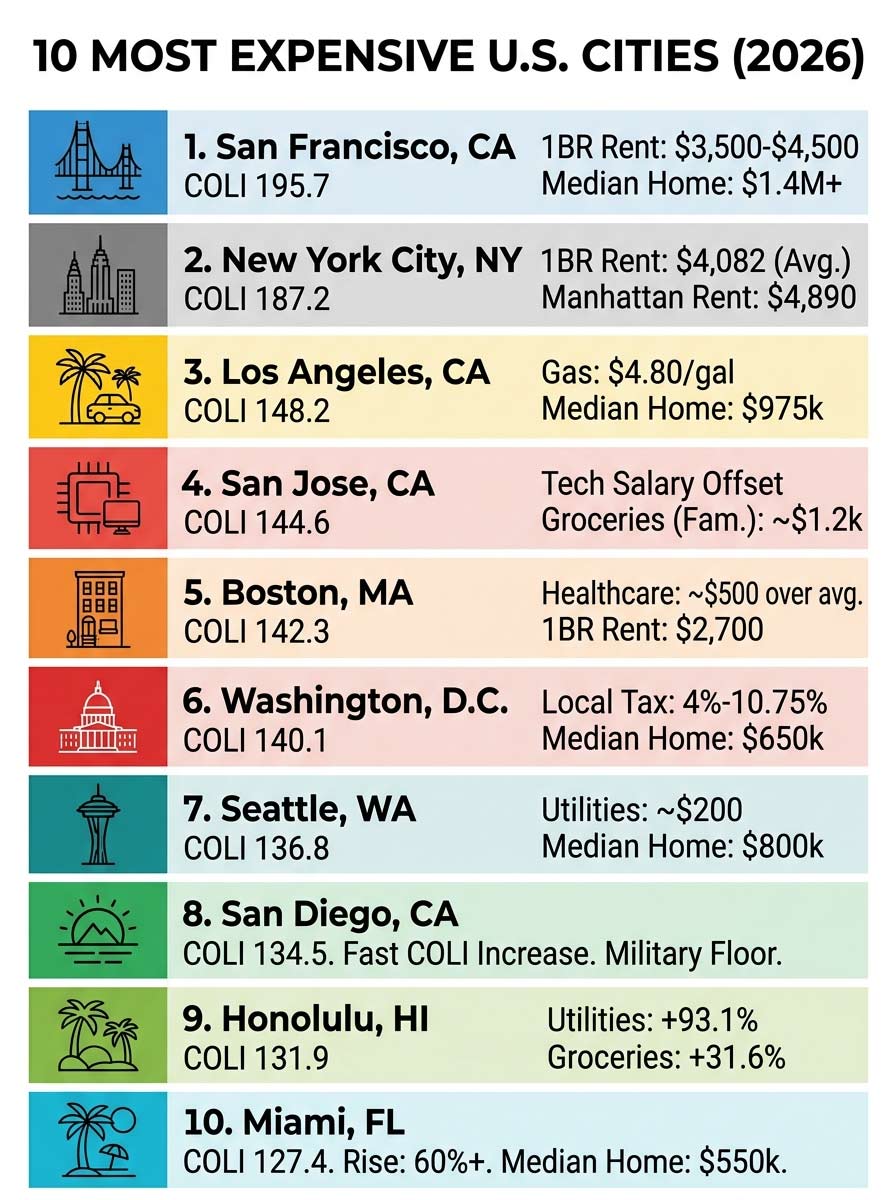
| Rank | City | COLI | Median Home | Avg. 1BR Rent | vs. Nat’l Avg | Primary Driver |
|---|---|---|---|---|---|---|
| #1 | San Francisco, CA | 195.7 | $1,400,000 | $3,500 – $4,500 | +95.7% | Housing (+154%); Tech wage-price spiral; land scarcity. |
| #2 | New York City, NY | 187.2 | $850,000+ | $4,890 (Manhattan) | +87.2% | Multi-tier taxes (NYC/NYS); Transport density premium. |
| #3 | Los Angeles, CA | 148.2 | $975,000 | $2,800 | +48.2% | Gas prices; Car dependency; High state income tax. |
| #4 | San Jose, CA | 144.6 | $1,300,000 | $2,900 | +44.6% | Silicon Valley land value; Groceries (+18% vs national). |
| #5 | Boston, MA | 142.3 | $750,000 | $2,700 | +42.3% | Healthcare costs; Education; 5% flat income tax. |
| #6 | Washington, D.C. | 140.1 | $650,000 | $2,500 | +40.1% | Gov-sector income inflation; Dining and service premiums. |
| #7 | Seattle, WA | 136.8 | $800,000 | $2,400 | +36.8% | Utility hikes; High sales tax (10.25%) despite no income tax. |
| #8 | San Diego, CA | 134.5 | $850,000 | $2,600 | +34.5% | Fastest rising overall California CoL (2026 study). |
| #9 | Honolulu, HI | 131.9 | $700,000 | $2,450 (avg) | +31.9% | Import dependency; Utilities (+93.1%); Groceries (+31.6%). |
| #10 | Miami, FL | 127.4 | $550,000 | $2,200 | +27.4% | Insurance crisis; Post-2020 rent acceleration. |
Sources: Jaynevy Tours 2026 Expense Ranking; Apartments.com NYC/SF/Honolulu Trends March 2026; Numbeo Index; LiveNOW from FOX January 2026.
City-by-City Cost Analysis (2026)
01. San Francisco, CA (COLI 195.7)
San Francisco’s cost of living index of 195.7 makes it the most expensive major city in the United States by a measurable margin. This is driven primarily by a housing market where supply has been structurally constrained for decades and where technology sector compensation has pushed demand well above what new construction has supplied. The median home price exceeds $1.4 million. One-bedroom apartments rent for $3,500 to $4,500 per month depending on neighborhood, with Nob Hill and Pacific Heights at the upper end and the Outer Sunset and Richmond districts offering the lower end of that range.
- Housing: 154.1% above national average ($2,504 to $5,656/month)
- Utilities: 49.4% above average (Avg. energy $328 to $389)
- Groceries: 15.5% above average (Coffee $7.10/lb, Milk $5.08)
- Transportation: 41.3% above average (Gas $4.32/gallon)
- Monthly Cost (Single): $5,915 inclusive of rent
- Income Needed: $180,000 to $220,000 for a family of four
What partially offsets it: No city income tax, though state rates reach 13.3 percent. High median tech salaries ($104,000) and robust public transit help absorb the housing premium.
02. New York City, NY (COLI 187.2)
New York City’s position as the second most expensive major U.S. city reflects a combination of extraordinary housing costs at the top end of the market with a broader city where cost varies more dramatically by borough than any other top-ten metro. ExtraSpace’s 2026 premium segment data shows an average apartment at $5,703 per month; Apartments.com’s March 2026 citywide average is $4,082 for a one-bedroom. Manhattan-specific averages run $4,890 for a one-bedroom and $6,191 for a two-bedroom. WalletHub’s January 2026 analysis ranked New York City first nationally for cost of living anxiety by search volume, with more than 26,100 related searches per month.
- Housing: Manhattan median $850,000+ (Condos often $2M+)
- Taxes: Combined City (3.8%) and State (10.9%) income taxes
- Transportation: Monthly subway pass $127 (Parking $250 to $600)
- Groceries: Standard grocery bill $600 to $900/month for couples
- Monthly Cost (Single): $6,200 to $7,500 in Manhattan
What partially offsets it: No car required in Manhattan, saving $800 to $1,200 per month. Unmatched career and network access.
03. Los Angeles, CA (COLI 148.2)
Los Angeles’s COLI of 148.2 places it third nationally, but it carries a unique cost structure compared to San Francisco and New York. While those cities are expensive primarily due to housing density and financial sector wages, Los Angeles adds car dependency as a structural cost multiplier. There is no viable alternative to car ownership for most residents, meaning households incur gas at $4.80 per gallon, car insurance at rates among the highest in the country, and highway tolls. The median home price of $975,000 reflects coastal land constraints, while the entertainment industry concentration in neighborhoods like Brentwood or Silver Lake creates local price floors.
- Housing: Median $975,000 (1BR Rent ~$2,800)
- Transportation: Gas $4.80/gal (High insurance, no transit)
- Taxes: Up to 13.3% State marginal rate
- Lifestyle: Entertainment and dining skew well above average
- Income Needed: $150,000 to $200,000 for families
04. San Jose, CA (COLI 144.6)
San Jose’s COLI reflects Silicon Valley’s unique combination of high tech sector compensation against the most constrained housing market of any major U.S. metro by land area. The median home price of $1.3 million is the second highest in the country. A family of four in San Jose spends approximately $1,200 per month on groceries alone, a figure reflecting both California food prices and the premium Silicon Valley’s consumer demand places on everyday goods.
- Housing: Median $1.3M (1BR Rent $2,900)
- Prop Tax: ~$14,300 annually on median home
- Groceries: ~$1,200/month for a family of four
- Daily Costs: Dining $18 to $25 per meal
Tech Salary Offset: Dual-income tech households often earn $200,000 to $400,000, supporting prices even as broader affordability recedes.
05. Boston, MA (COLI 142.3)
Boston’s COLI is driven by three reinforcing cost factors: compact housing in a geographically tight metro, healthcare costs in a medically intensive city, and education costs driven by private school competition. Healthcare costs run approximately $500 per month for family insurance above national averages, reflecting the premium commanded by systems like Mass General and Brigham and Women’s.
- Housing: Median $750,000 (1BR Rent $2,700)
- Taxes: 5% Flat Rate (9% for income over $1M)
- Healthcare: ~$500/month above national baseline
- Education: Private K-12 starts at ~$20,000/year
06. Washington, D.C. (COLI 140.1)
Washington D.C.’s COLI reflects a housing market where compensation from government, lobbying, and consulting sectors has sustained demand across a politically insulated employer base. Regardless of party power, the employment base within the District’s 10-mile radius remains stable and highly compensated. Median home prices of $650,000 and one-bedroom rents of $2,500 are the direct product of this income concentration against a geographically constrained District boundary.
- Housing: Median $650,000 (1BR Rent $2,500)
- Taxes: Local tax from 4% to 10.75%
- Dining: Restaurant meals average $20 per person
- Transit: WMATA Monthly pass ~$100
The Federal Employment Floor: D.C.’s cost structure is backstopped by federal employment that does not disappear in recessions, providing unique price stability.
07. Seattle, WA (COLI 136.8)
Seattle’s COLI is the highest of any city without a state income tax. The absence of Washington State income tax does not prevent Seattle from reaching the top ten because housing and utility costs have absorbed the tax savings. The Pacific Northwest technology ecosystem has produced compensation levels that sustain housing demand well above supply, pushing a median home price of $800,000. LiveNOW’s January 2026 analysis flagged public utility hikes as a primary driver, with residents absorbing significant electricity and water rate increases.
- Housing: Median $800,000 (1BR Rent $2,400)
- Utilities: ~$200/month and rising rapidly
- Taxes: 0% State Income Tax (10.25% Sales Tax)
- Tech Market: Median tech income approximately $87,000
08. San Diego, CA (COLI 134.5)
San Diego ranks first in the country for the rate of cost of living increase among major cities. While residents take home approximately $5,759 per month on average, cost increases have outrun income growth. The military’s permanent presence at Naval Base San Diego creates a housing demand floor that does not cycle down during tech corrections. This coastal climate premium, combined with significant private sector growth, supports persistent price floors.
- Housing: Median $850,000 (1BR Rent $2,600)
- Income: ~$5,759/month average take-home
- Military Floor: BAH supports high rental floors
- Offsets: Mild climate reduces utility heating/cooling needs
09. Honolulu, HI (COLI 131.9)
Honolulu’s premium is driven primarily by island import dependency. Virtually everything consumed arrives by ship or air, and Jones Act requirements significantly increase shipping costs. Utilities run 93.1 percent above the national average, the highest premium on this list. Housing costs are 199.1 percent above the national average, driven by land scarcity, tourism demand, and significant real estate investment from the mainland and abroad.
- Housing: 199.1% above average (Median $700,000)
- Utilities: 93.1% above average (Highest in top 10)
- Groceries: 31.6% above average
- Monthly Cost: ~$5,042 for a single person
Hawaii State Tax: Progressive rates reach 11 percent. High earners face one of the heaviest combined tax burdens in the country.
10. Miami, FL (COLI 127.4)
Miami represents the largest rank change on this list since 2019. Its inclusion in 2026 reflects post 2020 housing and rental price acceleration that transformed the city from an affordable alternative into a legitimately expensive market. The median home price of $550,000 is the lowest of the top ten but represents a market where prices have risen more than 60 percent from 2020 levels in several submarkets. Zero state income tax remains a meaningful offset.
- Housing: Median $550,000 (Rent ~$2,200)
- Insurance Crisis: Avg. premiums $4,000 to $8,000+
- Tax Advantage: 0% State Income Tax
- Cost Trajectory: Rising faster than any top 10 city
Benchmark: High-Cost Market Expense Breakdown (2026)
To understand the “Midwest Advantage,” one must first look at the baseline costs of major coastal and Sun Belt hubs. These figures represent the percentage above the national average that residents pay for core necessities in 2026.
| City | Housing | Groceries | Utilities | Transport | Income Tax |
|---|---|---|---|---|---|
| San Francisco | +154.1% | +15.5% | +49.4% | +41.3% | Up to 13.3% |
| New York City | +178% (MH) | +17.0% | +30.0% | Transit Focus | 4% – 10.9% + Local |
| Los Angeles | +121.0% | +11.0% | +23.0% | +38.0% | Up to 13.3% |
| San Jose | +145.0% | +18.0% | +39.0% | +28.0% | Up to 13.3% |
| Boston | +86.0% | +9.0% | +18.0% | +22.0% | 5% Flat + Surtax |
| Washington, D.C. | +72.0% | +8.0% | +14.0% | +19.0% | 4% – 10.75% |
| Seattle | +101.0% | +12.0% | +27.0% | +25.0% | 0% |
| San Diego | +109.0% | +13.0% | +21.0% | +21.0% | Up to 13.3% |
| Honolulu | +199.1% | +31.6% | +93.1% | +41.1% | Up to 11.0% |
| Miami | +58.0% | +7.0% | +19.0% | +16.0% | 0% |
Sources: Apartments.com 2026; ExtraSpace Storage; Numbeo Cost of Living Index March 2026; Payscale 2026; World Population Review 2026.
What Household Income You Actually Need
The most practically useful framing of cost-of-living data for a household evaluating relocation is not the index number but the income threshold required to achieve a specific quality-of-life outcome. The following estimates assume a household that owns a median-priced home (or pays equivalent rent), runs one or two vehicles where car ownership is structurally required, maintains typical childcare and school costs, and lives without financial stress rather than at minimal adequacy.
- San Francisco and San Jose: A family of four purchasing at the median price point ($1.3M to $1.4M) with a 20 percent down payment faces a mortgage of approximately $7,200 to $8,000 per month before taxes and insurance. Combined with childcare (averaging $2,500 to $3,500/month per child in the Bay Area), groceries, and utilities, the household income required to live without financial stress as a homeowner in these markets is approximately $250,000 to $350,000. Dual-income technology households achieving this threshold exist in significant numbers, which is why prices remain at these levels despite the nominal unaffordability to most U.S. households.
- New York City: A Manhattan renter at $4,890/month for a one-bedroom plus $127 transit pass plus New York’s combined city and state income tax structure requires approximately $130,000 to $160,000 in pre-tax income to maintain moderate financial comfort as a single renter. A family in outer boroughs purchasing a two-family home requires household income of approximately $200,000 to $250,000 for financial stability without subsidy.
- Boston and Washington D.C.: Both cities support comfortable family life at household incomes of $150,000 to $200,000, which is challenging for households at the national median but achievable for dual-income professional couples in their employment clusters. Boston’s healthcare employment anchor and D.C.’s government and consulting base both produce median household incomes well above these thresholds in their primary employment sectors.
- Seattle and San Diego: Seattle’s no-income-tax structure makes a $175,000 household income go meaningfully further than the same income in California cities with comparable housing costs. San Diego at the same income level requires more careful management due to the combination of California’s income tax rate and housing costs approaching San Francisco levels without San Francisco’s tech compensation premiums available to most workers outside the specific biotech and defense contractor clusters.
- Honolulu: LivingCostIndex’s 2026 data estimates a family of four’s annual cost at $117,307. Against Hawaii’s state income tax rate of up to 11 percent, the gross household income required to achieve that net spending capacity starts at approximately $160,000 to $180,000 per year. Honolulu’s employment market, outside of tourism, military, and healthcare, does not produce this income level for most residents, which is why housing cost burden ratios in Honolulu are among the highest in the country.
- Miami: Florida’s zero income tax and Miami’s position as the lowest-indexed top-ten city (127.4) mean that a household earning $120,000 to $150,000 can achieve moderate homeowner comfort here at price levels that would require $180,000 to $220,000 in California equivalents. The wildcard is homeowners insurance, which can add $4,000 to $8,000 annually to housing costs in Miami-Dade County and must be included in any realistic budget before characterizing Miami as affordable relative to California.
FAQ
What is the most expensive city to live in the United States in 2026?
San Francisco, California holds the highest cost-of-living index of any major U.S. city at 195.7, meaning it is 95.7 percent more expensive than the national average overall. The median home price exceeds $1.4 million, the average one-bedroom apartment rents for $3,500 to $4,500 per month, and the average single person’s total monthly expenses including rent reach $5,915 per the LivingCostIndex 2026 data. Housing costs in San Francisco run 154.1 percent above the national average, utilities run 49.4 percent above, and transportation runs 41.3 percent above. While Coupons.com’s January 2026 analysis identifies Paradise Valley, Arizona as having the technically highest cost-of-living index at 223 among all U.S. cities including small luxury enclaves, San Francisco is the most expensive major metropolitan area where typical households live and work rather than a high-end resort enclave.
Is New York City or San Francisco more expensive to live in?
By overall cost-of-living index, San Francisco ranks higher at 195.7 versus New York City’s 187.2, making San Francisco approximately 8.5 index points more expensive on a composite basis. However, the comparison is nuanced by the dramatic internal variation within New York City. Manhattan-specific housing costs represent the most expensive residential real estate market in the country after the Bay Area, with average Manhattan one-bedroom rents at $4,890 per month per Steadily’s 2026 data and ExtraSpace’s premium segment average at $5,703. San Francisco’s average one-bedroom of $3,500 to $4,500 is cheaper than prime Manhattan by a meaningful margin. The composite index favors San Francisco because it does not include the car ownership costs that Manhattan residents avoid; when Manhattan renter households are isolated and compared to San Francisco renters, the New York premium becomes more competitive with San Francisco’s. For homebuyers specifically, San Francisco’s $1.4 million median versus Manhattan’s $850,000 median (with significantly more variation at the upper end) makes San Francisco the more expensive ownership market.
What cities in the US have the highest rent in 2026?
The highest average rents in the United States in 2026 are concentrated in Manhattan and San Francisco. Manhattan averages $4,890 per month for a one-bedroom, with two-bedrooms averaging $6,191 and three-bedrooms starting at $6,500 per Steadily’s 2026 analysis. ExtraSpace’s premium New York City segment shows an average apartment rent of $5,703. San Francisco’s one-bedroom average runs $3,500 to $4,500 depending on neighborhood. Boston and Seattle follow at $2,700 and $2,400 respectively, then San Diego at $2,600, Washington D.C. at $2,500, Los Angeles at $2,800, San Jose at $2,900, and Honolulu at $2,300 to $2,600. The national average one-bedroom rent as of March 2026 is approximately $1,627 per month per Apartments.com, making Manhattan rents 151 percent above the national average and San Francisco rents approximately 115 percent above.
What is the most expensive state to live in the United States?
Hawaii holds the highest statewide cost-of-living index at 185.0 per World Population Review’s 2026 state rankings, driven primarily by island import dependency that inflates the cost of virtually all consumer goods and energy above mainland levels. California ranks second at a statewide index of 142.3, with its major coastal metros anchoring the average. Massachusetts is third at 141.2, the District of Columbia fourth at 138.8, and New York fifth at 125.1. States with no income tax, notably Washington, Florida, and Texas, appear lower on the statewide index despite hosting expensive individual metros because their statewide averages are pulled down by inland and rural communities well below the coastal market premium. Washington State’s statewide index runs 114.1 despite Seattle’s COLI of 136.8.
How much do you need to earn to live comfortably in the most expensive U.S. cities?
The income threshold for comfortable family living (homeownership, two children, no persistent financial stress) varies significantly across the top ten. In San Francisco and San Jose, dual-income household earnings of $250,000 to $350,000 are typical among homeowning families given the $1.3 to $1.4 million median home prices. In New York City’s outer boroughs, $200,000 to $250,000 household income supports comfortable family life; Manhattan family homeownership requires significantly more. Boston and Washington D.C. are achievable at $150,000 to $200,000 for dual-income professional households. Seattle’s no-income-tax structure means that $175,000 in Seattle leaves more disposable income than $175,000 in any California top-ten city. Honolulu requires approximately $160,000 to $180,000 gross for a family of four to cover the $117,307 annual total cost estimated by LivingCostIndex 2026 after Hawaii’s income tax. Miami at the lowest COLI of the ten cities can support comfortable family homeownership at $120,000 to $150,000, though homeowners insurance premiums of $4,000 to $8,000 annually must be included in that calculation.
References
- U.S. Bureau of Labor Statistics: Consumer Price Index Summary
- Numbeo: 2026 Cost of Living Index by North American City
- Zillow Research: February 2026 Home Value and Rent Index
- Kiplinger: Most Expensive Cities in the US in 2026
- C2ER / Siena Research Institute: Q1 2026 Cost of Living Index (COLI) National Rankings
- Payscale: 2026 Cost of Living Analysis – Compensation and Purchasing Power by City
- Bankrate: 2026 Cost of Living Calculator – Comparing Major U.S. Metros
- World Population Review: 2026 Cost of Living Index by State